How to read a lipid panel, line by line
A lipid panel comes back as five to eight lines, and most people read the one that says LDL, check whether it's flagged, and close the PDF.
The useful thing to know first is that a standard lipid panel measures only three things: total cholesterol, HDL cholesterol and triglycerides. Most of the other lines, often including LDL, are calculated from those three. A calculated line inherits every wobble in its inputs, so when triglycerides jump, LDL, VLDL and the ratios can all move on paper while nothing about your LDL changed.
What each line on a lipid panel is
| Line | Measured or calculated | What it is |
|---|---|---|
| Total cholesterol | Measured | All the cholesterol in the blood, in every kind of particle |
| HDL cholesterol | Measured | Cholesterol carried in HDL particles |
| Triglycerides | Measured | Fat carried in the blood, the line most changed by a recent meal |
| LDL cholesterol | Usually calculated, sometimes measured ("direct LDL") | Cholesterol carried in LDL particles |
| VLDL cholesterol | Calculated | Cholesterol in the particles that mostly carry triglycerides |
| Non-HDL cholesterol | Calculated | Total minus HDL: everything except HDL |
| Total/HDL ratio, LDL/HDL ratio | Calculated | One line divided by another |
The classic way labs calculate LDL is the Friedewald equation from 1972 (Friedewald et al., 1972): LDL = total cholesterol − HDL − triglycerides ÷ 5, all in mg/dL. The "triglycerides ÷ 5" part is the lab's VLDL line. Many labs now use newer equations or measure LDL directly, and the report usually says which in small print, often with "calc." or "direct" next to the name.
Which lines move together
Because so much is derived, some lines can't move independently:
- When triglycerides rise, the calculated VLDL rises with them, and a Friedewald LDL drops by the same amount. Our post on VLDL cholesterol shows what that looks like.
- When HDL falls, non-HDL and both ratios get worse even if total cholesterol stays the same.
- Non-HDL doesn't use triglycerides at all, so a non-fasting sample changes it much less than LDL. That's covered in the post on non-HDL cholesterol.
This is the three measured lines from the same person across two years, each in its own strip:
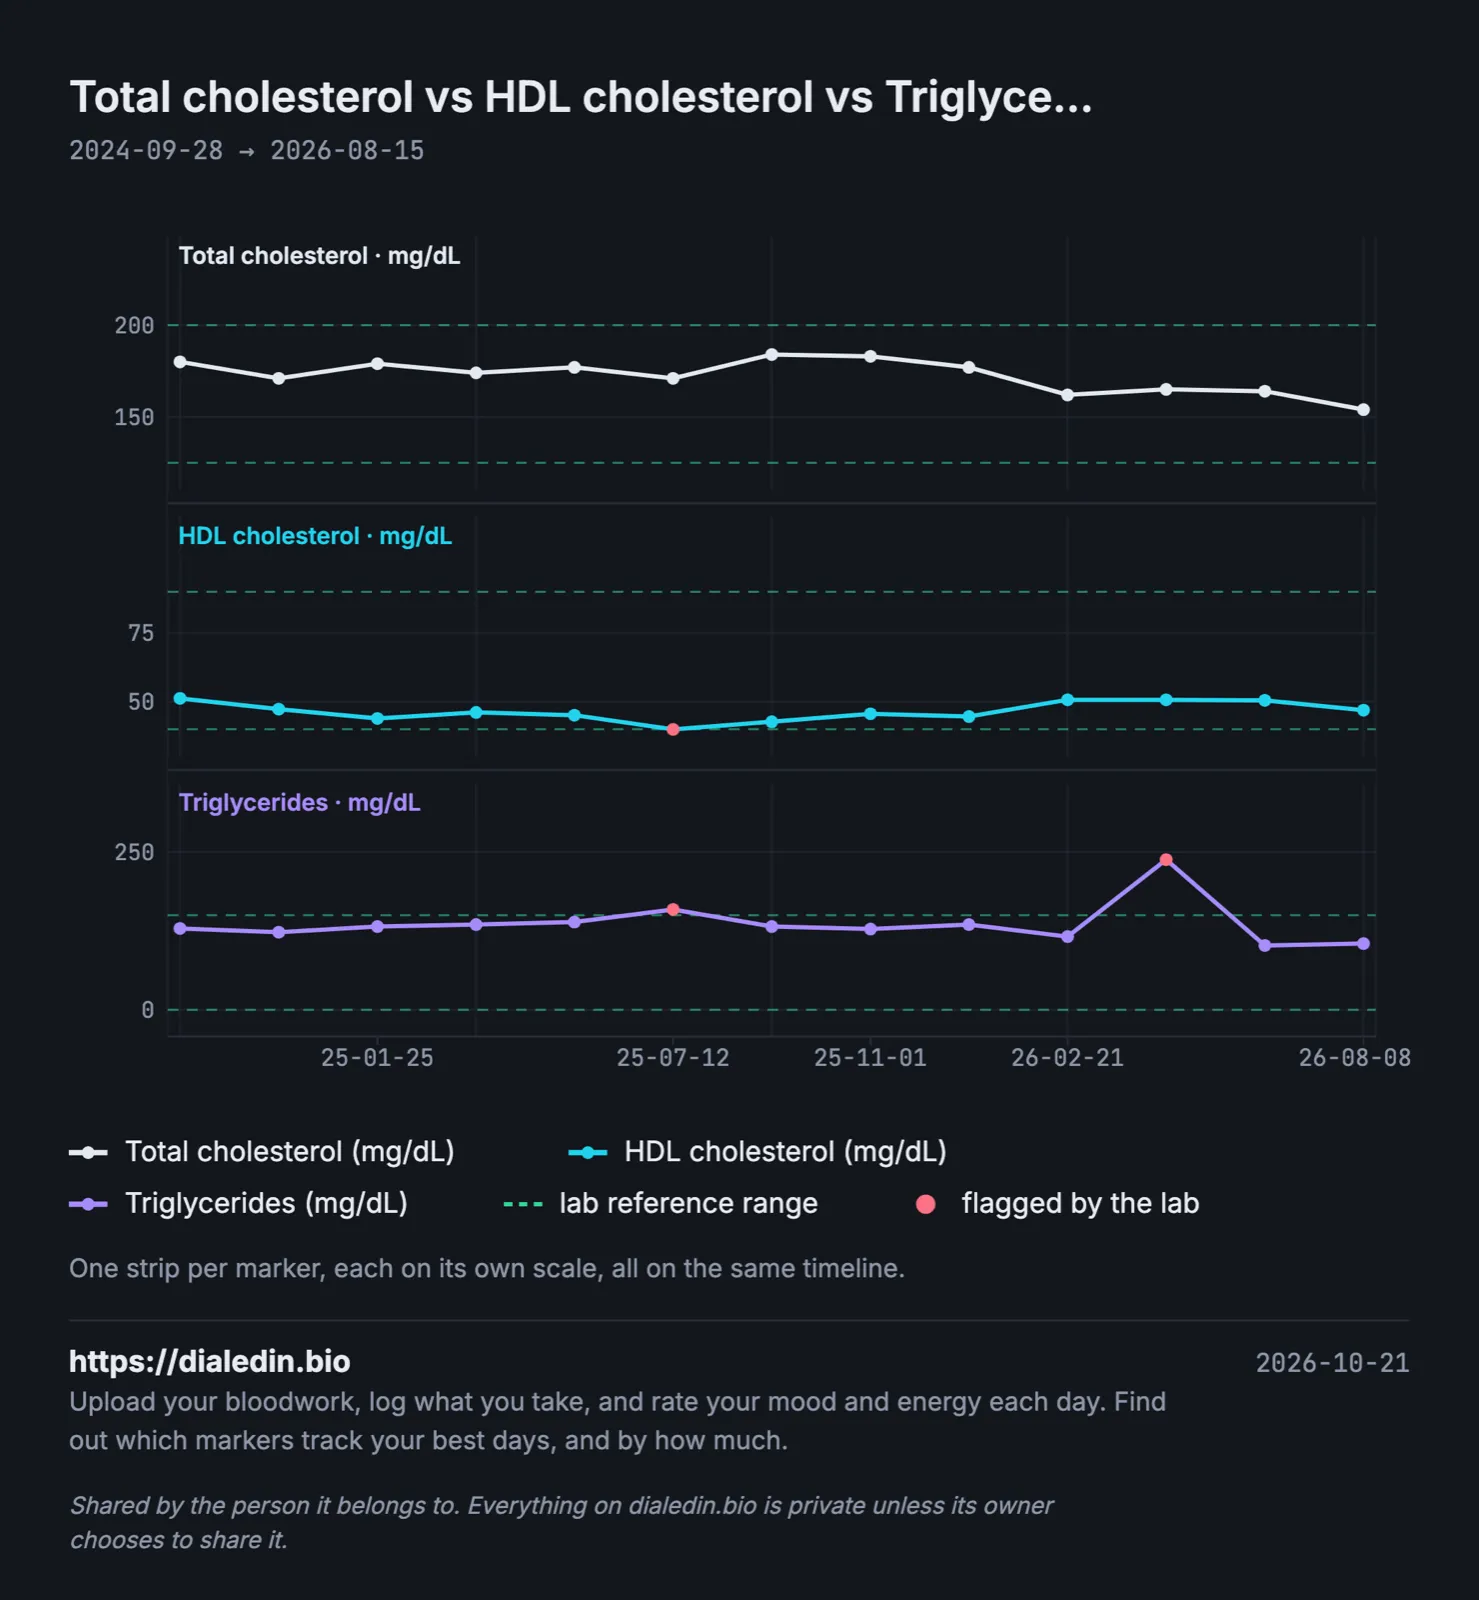
Sample data, not a real person.
The triglyceride spike is one test taken after breakfast. Everything calculated from that report moved with it. The total cholesterol strip barely noticed.
Two extra tests some panels add
ApoB counts the particles that carry cholesterol into artery walls, one ApoB per particle, and it isn't calculated from anything. Our post on ApoB vs LDL explains what it adds. Lipoprotein(a) is mostly inherited and usually measured once; the post on lipoprotein(a) covers that one.
How to make lipid results comparable
Keep fasting the same every time
For years everyone fasted before a lipid panel. A 2016 European consensus statement said non-fasting samples are fine for most routine testing, because total cholesterol, HDL and LDL change little after an ordinary meal (Nordestgaard et al., 2016). Triglycerides do change. Fasting or not is your doctor's call. What matters for a trend is doing the same thing each time and writing down which it was.
Skip alcohol the evening before
Alcohol raises triglycerides for a day or so, and the calculated lines follow.
Don't test during or just after an illness
An infection or surgery can lower total cholesterol and HDL for weeks. A panel taken then describes the illness.
Note medicines, and the date they started or changed
Statins, thyroid medicine, steroid medicines, hormone therapy and some blood pressure medicines all move lipids. A start date next to the result explains a step.
Look for "calc." or "direct" next to LDL
A lab switch from calculated to direct LDL, or from Friedewald to a newer equation, can move LDL by a few points with no real change. Write the method down.
Watch the units
US labs report cholesterol in mg/dL, most other places in mmol/L. For cholesterol, 1 mmol/L is about 38.67 mg/dL. Triglycerides use a different factor, about 88.57, because the molecule is heavier. Convert each line with its own factor.
How often should a lipid panel be repeated?
Your doctor sets that from your age, your risk and any treatment. Many adults are tested every few years when results are steady, and more often after starting or changing a cholesterol medicine, when a recheck after a couple of months is common. Several results taken the same way show a direction that one panel can't.
A layout for tracking it by hand
| Date | Lab | Fasted | Total | HDL | Triglycerides | LDL | LDL method | Notes |
|---|---|---|---|---|---|---|---|---|
| 2026-02-22 | City Lab | yes | 162 | 51 | 116 | 88 | Friedewald | |
| 2026-04-19 | City Lab | no | 165 | 51 | 238 | 67 | Friedewald | breakfast before |
| 2026-06-14 | City Lab | yes | 164 | 51 | 102 | 93 | Friedewald |
The second row's LDL looks like a big improvement. The fasted column and the triglycerides show it's arithmetic.
Where dialedin fits
We built dialedin so the whole panel stays together on one timeline.
You upload a lab PDF and it's read into individual markers, which you check before saving. Every report goes onto one timeline, and the same marker under different lab names stays one line. You can chart several lines at once, like the strips above, and record what you take and when. Optional daily check-ins sit alongside, and you can export your history as a PDF for your doctor.
It's free while we're in beta. If your lipid panels are scattered across PDFs, put them on one chart and see which lines actually moved.
This article is general information, not medical advice, and it can't take your own history into account. Talk to your doctor about your cholesterol results and what they mean for you.