ApoB vs LDL: what the extra test adds
Most people know their LDL cholesterol. It's on every routine lipid panel, and it's the number a doctor quotes when the subject comes up. ApoB is newer to most people, and it tends to appear when someone pays for a private panel or asks for "the better cholesterol test".
The two measure different things. LDL cholesterol (LDL-C) is how much cholesterol is carried inside LDL particles. ApoB is a count of the particles themselves: every particle that can deliver cholesterol into an artery wall carries exactly one apolipoprotein B molecule, so measuring ApoB counts them. Most of the time the two agree. When they don't, it's usually in a predictable group of people, and the disagreement is the reason the test exists.
What ApoB counts that LDL doesn't
Cholesterol travels in the blood inside particles called lipoproteins. LDL is the best known, but VLDL, IDL and lipoprotein(a) carry cholesterol too, and all of them have one ApoB molecule each. Apolipoprotein B therefore counts the whole family of these particles in one number.
LDL cholesterol measures the cargo, and only in one kind of particle. If each LDL particle carries a normal amount of cholesterol, the cargo and the count rise and fall together, and ApoB adds little. If the particles are small and carry less cholesterol each, you need more of them to carry the same total. LDL-C then looks ordinary while the particle count is high.
When ApoB and LDL disagree
The mismatch, which lipid specialists call discordance, shows up most often in people with high triglycerides, insulin resistance, type 2 diabetes or a lot of weight around the middle. The same metabolic changes that raise triglycerides tend to produce more, smaller LDL particles. In that group LDL-C can understate the particle count.
The European guideline on lipids recommends ApoB for exactly that group: people with high triglycerides, diabetes, obesity or very low LDL-C (Mach et al., 2019). It's also one reason ApoB turns up so often next to an insulin resistance test.
This is LDL cholesterol and ApoB across 13 tests for someone whose triglycerides were climbing:
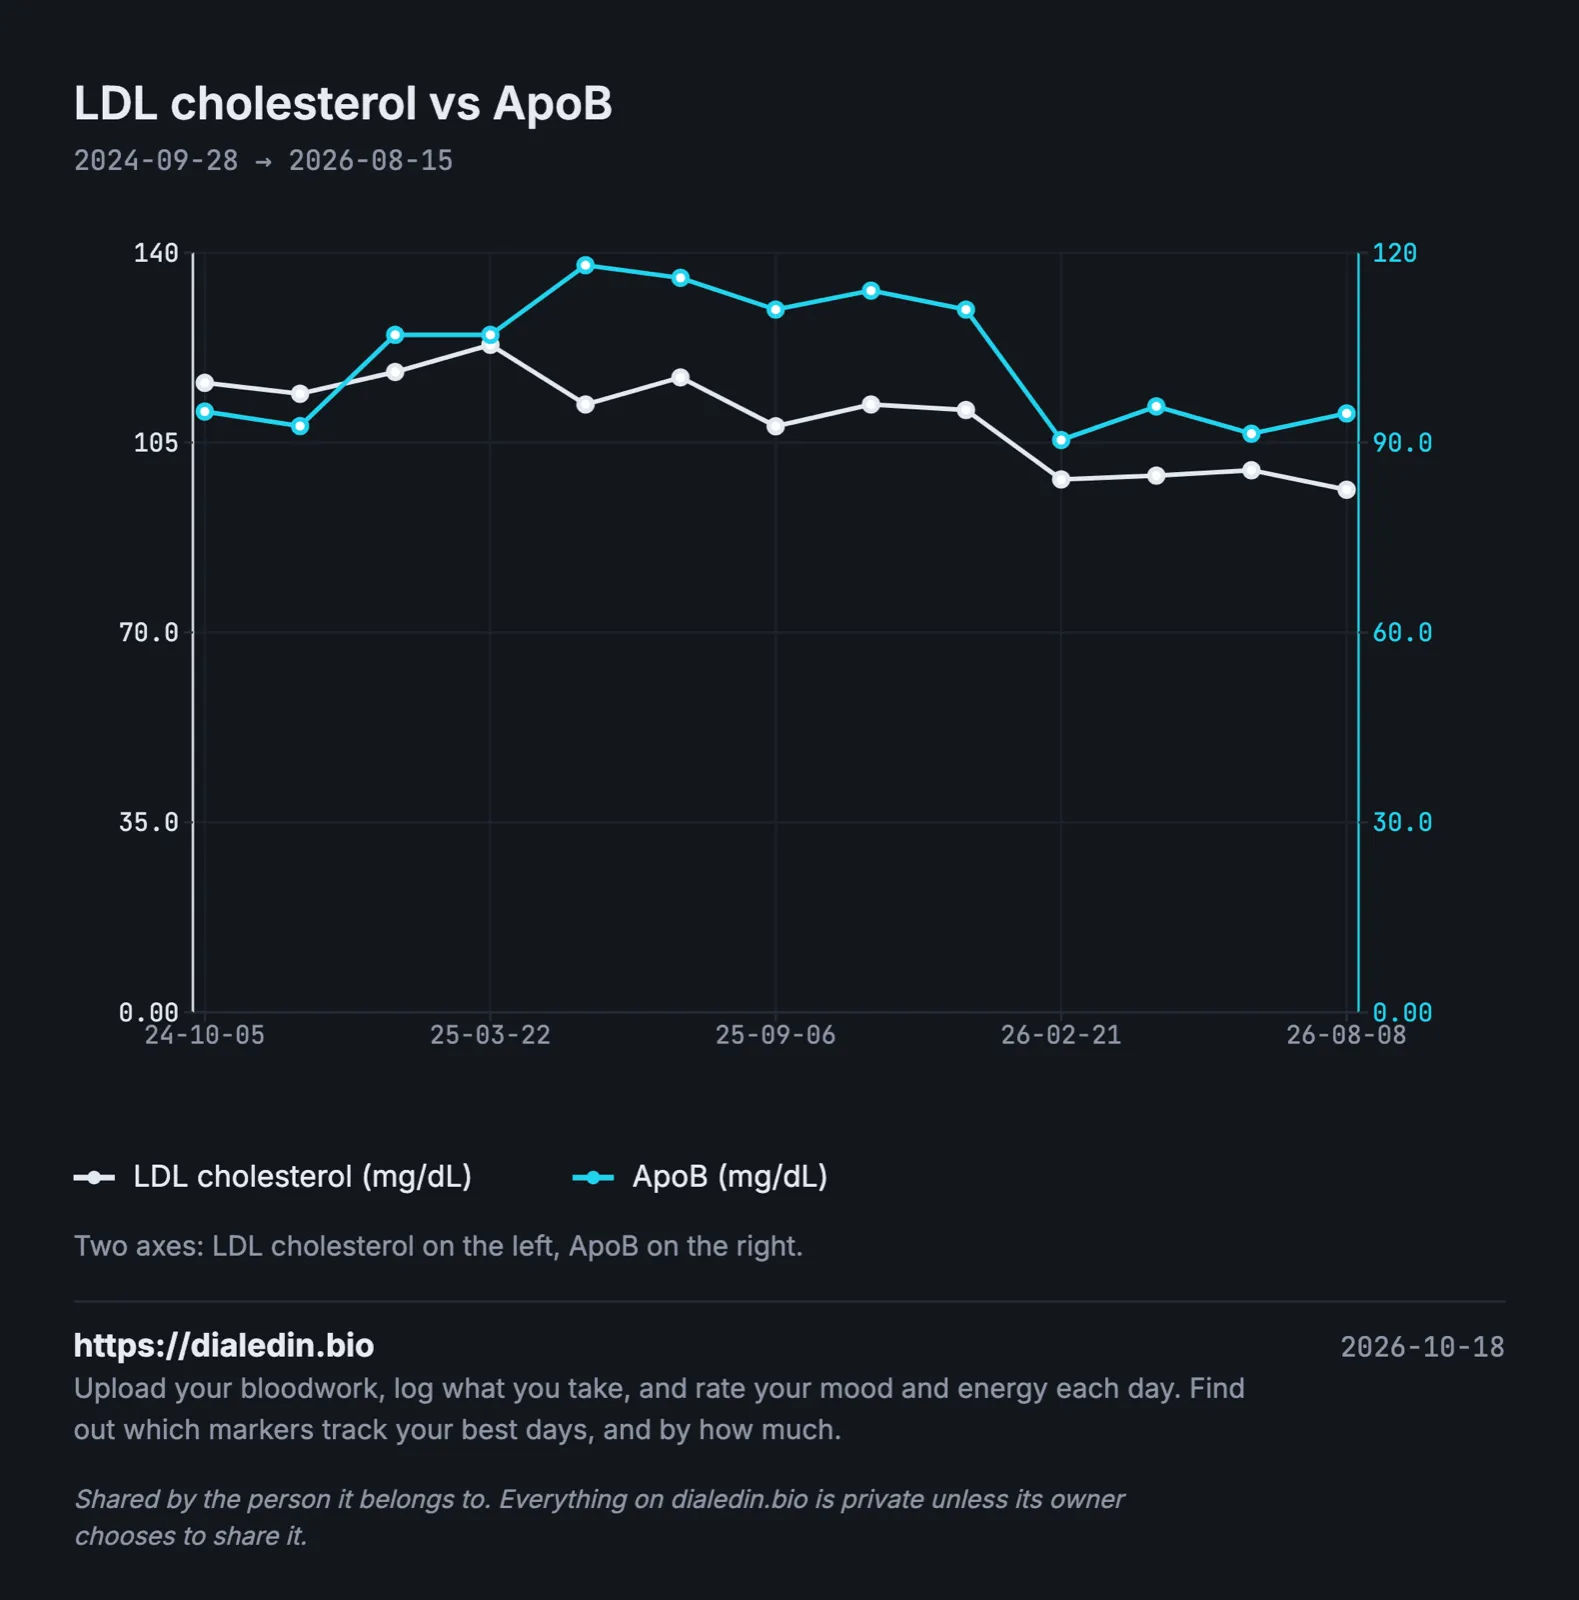
Sample data, not a real person.
For the first year the LDL line says nothing much is happening. The ApoB line says the particle count went up by about a quarter. That's the case the test was added for.
Non-HDL cholesterol: the free middle option
Most people already have a third number, at no extra cost. Non-HDL cholesterol is total cholesterol minus HDL, so it counts the cholesterol in every ApoB particle, not just LDL. It usually tracks ApoB more closely than LDL-C does, and it's calculated from lines that are already on a standard panel.
If your lab doesn't print it, subtract HDL from total cholesterol yourself. Use numbers from the same report, in the same units.
Why your LDL may be an estimate
Many labs don't measure LDL-C at all. They calculate it from total cholesterol, HDL and triglycerides. The classic Friedewald formula is LDL = total cholesterol − HDL − triglycerides ÷ 5, in mg/dL. It gets less accurate when triglycerides are high or LDL is low, which is the same group where ApoB matters most. Newer formulas, such as Martin-Hopkins and Sampson, do better, and some labs measure LDL directly.
Check your report for "calc" or "calculated" next to LDL. If one lab calculates it and the next measures it, part of any change is the method.
How to make ApoB and LDL results comparable
Keep the fasting the same each time
ApoB barely changes after a meal, and many labs now accept non-fasting lipid panels. Triglycerides do rise after eating, and a calculated LDL uses triglycerides, so a fasted test and a non-fasted test can give different LDL numbers from the same blood. Pick one and stick with it.
Check the units
ApoB is printed in mg/dL or g/L. 1 g/L is 100 mg/dL, so 0.95 g/L and 95 mg/dL are the same result. Cholesterol comes in mg/dL or mmol/L, and converting cholesterol between them means multiplying or dividing by 38.67. Mixing units on one chart produces jumps that aren't there.
Note how LDL was measured
Calculated, measured directly, and which formula if the report says. A one-word note per result is enough.
Note what changed
A new medication, a big change in diet, losing or gaining weight, or a period of heavy drinking all move lipids. Write the date next to the result so you can see what the change did.
Track triglycerides and HDL on the same chart
They explain most ApoB-LDL disagreements. Our post on tracking HbA1c over time shows how they fit with the blood sugar markers.
Don't test during an illness
Infections and inflammation shift lipids for a few weeks, and usually lower cholesterol. A test taken while ill describes the illness.
How often should ApoB be checked?
That's for your doctor to decide, and it depends on your risk and on any treatment. Some general anchors: a baseline result next to your first full lipid panel, a recheck a couple of months after any change you or your doctor make, and regular spacing after that. If ApoB and LDL agreed closely on your first few tests and nothing changed, your doctor may not need both every time.
Tracking ApoB and LDL by hand
A spreadsheet with the whole lipid panel on one row makes a disagreement easy to spot.
| Date | Lab | Total chol. | HDL | Triglycerides | LDL-C | LDL method | Non-HDL | ApoB | Fasted | Notes |
|---|---|---|---|---|---|---|---|---|---|---|
| 2025-01-14 | City Lab | 190 | 48 | 118 | 118 | calculated | 142 | 96 | yes | |
| 2025-07-08 | City Lab | 190 | 42 | 152 | 118 | calculated | 148 | 117 | yes | |
| 2026-01-20 | City Lab | 178 | 46 | 112 | 110 | calculated | 132 | 101 | yes | started metformin in July |
All values in mg/dL. In the second row LDL is unchanged while non-HDL and ApoB both rose with the triglycerides.
Where dialedin fits
We built dialedin because a table like that gets long and hard to read.
You upload a lab PDF and it is read into individual markers, which you check before saving. Every report lands on one timeline, and the same marker under different lab names stays one line. You can chart two markers on the same graph, as in the image above, and mark what you were taking and when so each result sits next to it. If you want, a daily check-in shows which levels line up with your better days, and you can export your history as a PDF for your doctor.
It's free while we're in beta. If your lipid panels are spread across PDFs, put them on one chart and compare ApoB with LDL yourself.
This article is general information, not medical advice, and it can't take your own history into account. Talk to your doctor about which lipid tests you need and what your results mean for you.