Insulin resistance tests: HOMA-IR, insulin and HbA1c
People who want to know whether they're insulin resistant usually look at their fasting glucose. If it's in range, they assume they're fine.
Fasting glucose is often the last of these numbers to move. When the body starts responding less to insulin, the pancreas makes more of it, and for a long time the extra insulin keeps glucose looking normal. Fasting insulin can climb for years before glucose does. That's why an insulin resistance test is really a handful of results read together, and why the trend in them says more than any one draw.
Is there a blood test for insulin resistance?
Not one routine test. The reference method in research is the hyperinsulinaemic-euglycaemic clamp, a several-hour procedure with infusions that no ordinary clinic does. Everything you can get from a normal blood draw is an estimate of it.
These are the ones you'll see on a report.
| Test | What it measures | What to know |
|---|---|---|
| Fasting glucose | Blood sugar after an overnight fast | Often stays in range while insulin rises |
| Fasting insulin | How much insulin it takes to hold that glucose | Not standardised between labs, so results from two labs don't compare well |
| HOMA-IR | A score worked out from fasting glucose and fasting insulin | Only valid on fasting values. Cutoffs differ between studies and populations |
| HbA1c | Average blood sugar over roughly the last two to three months | Can read high or low for reasons unrelated to sugar, such as anaemia or a recent blood loss |
| Triglycerides to HDL ratio | Two lipid results divided | A rough indirect sign that tends to rise with insulin resistance |
| Oral glucose tolerance test | Glucose, sometimes insulin, before and after a sugar drink | Longer test, ordered when a doctor wants more detail |
What HOMA-IR is, and what it adds
HOMA-IR comes from a model published in 1985 that estimates insulin resistance from one fasting glucose and one fasting insulin (Matthews et al., 1985). The arithmetic is simple, and our HOMA-IR calculator does it with either glucose unit.
What it adds is visible when glucose stays put. These rows hold fasting glucose at 90 mg/dL and change only insulin:
| Fasting glucose | Fasting insulin | HOMA-IR |
|---|---|---|
| 90 mg/dL | 4 µIU/mL | 0.89 |
| 90 mg/dL | 8 µIU/mL | 1.78 |
| 90 mg/dL | 12 µIU/mL | 2.66 |
| 90 mg/dL | 16 µIU/mL | 3.55 |
The glucose result on all four lines is identical, and HOMA-IR is four times higher on the last line than the first. Someone reading only glucose would see four identical results.
Because fasting insulin assays differ between labs, a HOMA-IR from one lab and one from another aren't directly comparable. Your own results from one lab, over time, are.
Other results that tend to move with it
Insulin resistance rarely shows up in one marker alone. These often shift alongside it, and each is worth noticing and raising with your doctor if it moves, though each also has other explanations.
- Triglycerides tend to rise and HDL cholesterol tends to fall.
- SHBG is often low. We cover that in high or low SHBG.
- ALT, a liver enzyme, sometimes creeps up when fat builds up in the liver.
- Uric acid is often higher.
- Waist size and weight usually move in the same direction as fasting insulin.
How to make the results comparable
Fasting insulin and glucose are easy to disturb, so most of the noise between two tests comes from the morning of the draw. These habits remove most of it.
Fast properly, and the same way every time
Nothing but water for at least eight hours, usually overnight. Coffee with milk or a juice on the way to the lab raises insulin, and HOMA-IR is meaningless on a non-fasting sample. If you couldn't fast, note it and don't compare that result with the others.
Test at the same time of the morning
Glucose and insulin both follow a daily rhythm, and a long fast that runs to midday isn't the same as one that ends at eight. Pick a time and keep it.
Use the same lab for insulin
This matters more for insulin than for most markers, because the methods aren't standardised. Changing labs can move fasting insulin by more than a real change would.
Avoid testing when you're ill or short of sleep
An infection or a run of bad nights can push glucose and insulin up for a while. If a test falls in a week like that, write it down.
Note new medication
Steroids such as prednisone raise blood sugar, and several other medicines move glucose or insulin in one direction or the other. Put a line next to any result drawn after a change.
Keep a weekly weight average
Daily weight bounces with water and salt. One weigh-in per day, averaged over the week before each test, gives a number you can compare with your insulin trend.
Check the units
Glucose is in mg/dL or mmol/L, insulin in µIU/mL or pmol/L, HbA1c in % or mmol/mol. Pick one unit per marker before you chart anything. Our free calculators convert the common ones.
How often to check
There's no standard schedule for fasting insulin, so ask your doctor what makes sense for you. Glucose and HbA1c are part of many routine checkups, and adding insulin to the same draw is often all it takes to get HOMA-IR.
If you're changing something on purpose, such as diet, training or a medication, a test before and one a few months after is how you find out what it did. HbA1c in particular needs about three months to reflect a change.
What a slow climb looks like
This is one person's fasting insulin across 13 tests over two years:
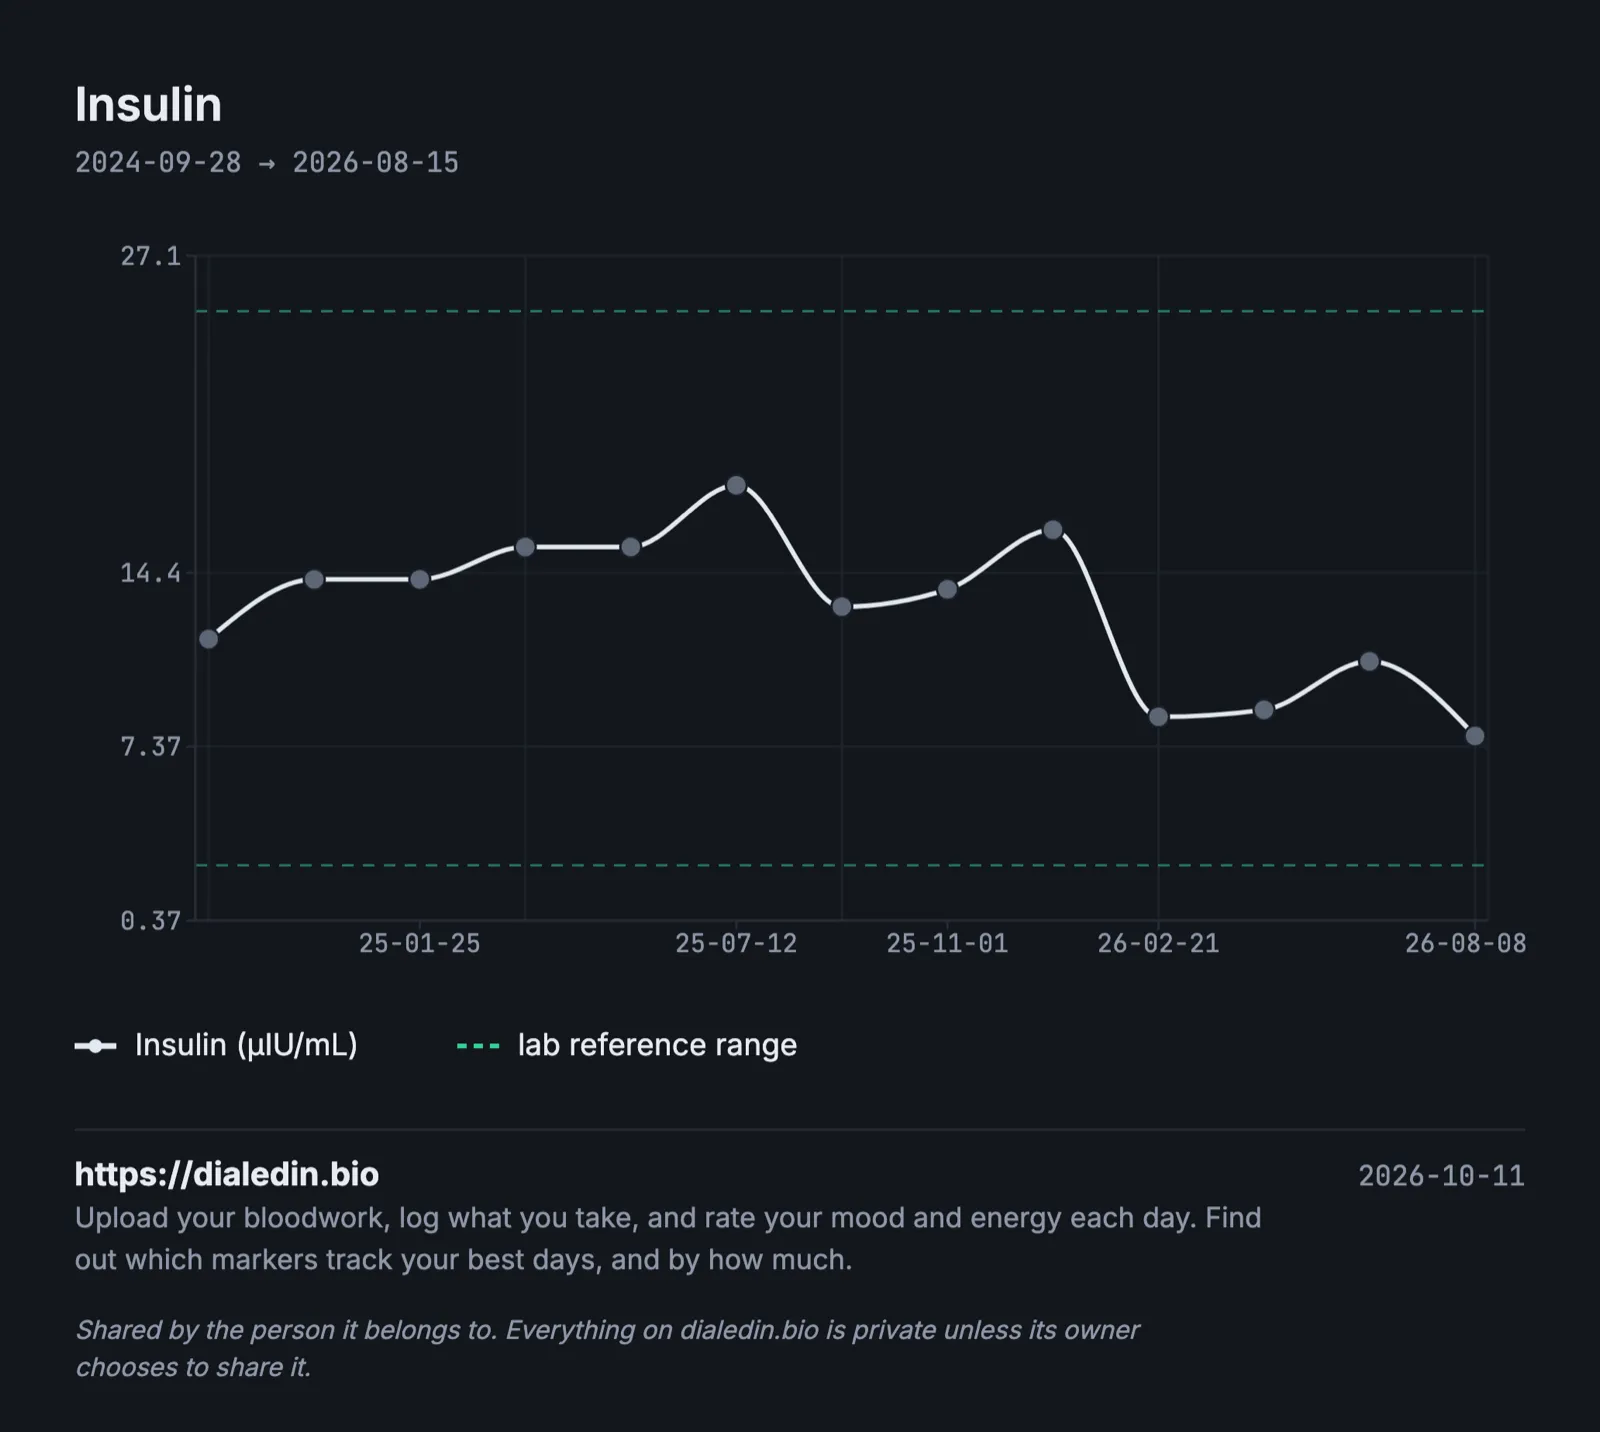
Sample data, not a real person.
Every result is in range, so no report flagged anything. Over the first year, fasting insulin rose by about half while his fasting glucose rose only a few mg/dL, which is exactly the pattern a glucose-only reading misses. The fall after mid-2025 lines up with a change he made, and seeing that is the reason to keep the earlier results.
Tracking it in a spreadsheet
One row per test, with the fasting details next to the results:
| Date | Lab | Glucose (mg/dL) | Insulin (µIU/mL) | HOMA-IR | HbA1c (%) | Triglycerides (mg/dL) | HDL (mg/dL) | Weekly weight | Fasted hours | Notes |
|---|---|---|---|---|---|---|---|---|---|---|
| 2025-01-14 | City Lab | 90 | 12 | 2.66 | 5.3 | 120 | 47 | 94 kg | 12 | |
| 2025-05-06 | City Lab | 92 | 15 | 3.41 | 5.4 | 131 | 45 | 95 kg | 11 | |
| 2025-09-09 | City Lab | 89 | 11 | 2.42 | 5.3 | 112 | 48 | 91 kg | 12 | walking daily since June |
Work HOMA-IR out the same way each time, and leave out any draw that wasn't fasted. Our post on tracking HbA1c over time goes further into the blood sugar side.
Where dialedin fits
We built dialedin because keeping those columns up to date by hand is the part nobody keeps doing.
You upload a lab PDF and it is read into individual markers, which you check before saving. Glucose, insulin, HbA1c and lipids go onto one timeline, and different lab names for the same marker are merged into one line. You can log body weight, record what you changed and when, and add a short daily check-in to see which levels line up with your better days. Before an appointment you can export your history as a PDF for your doctor.
It is free while we are in beta. There is more on the metabolic side of dialedin, or you can put your results on one timeline now.
This article is general information, not medical advice, and it can't take your own history into account. Talk to your doctor about which tests you need and what your results mean for you.