How to track HbA1c and blood sugar over time
Most people check HbA1c once a year and look at one thing: is it over the line or not? If it isn't, the result goes into a folder and nobody thinks about it again until next year.
Two facts make it worth more than that. HbA1c is an average of your blood sugar over roughly the last two to three months, because it measures sugar stuck to red blood cells, which live about three months. So each result covers a stretch of your life, and a run of results shows whether those stretches are getting better or worse. And it can rise slowly for years while staying under every cut-off. To track HbA1c over time in a useful way, you need the results lined up, alongside what you changed in between.
Which results to track together
HbA1c is the headline, but it moves slowly and doesn't explain itself. These are the markers that usually sit next to it. Each is worth noticing and raising with your doctor if it moves, and each can move for ordinary reasons.
- HbA1c is reported as a percentage or in mmol/mol, depending on the country. Pick one and convert the rest.
- Fasting glucose is a single moment, so it is noisier than HbA1c. A bad night's sleep or a cold can push it up for a day.
- Fasting insulin often rises years before glucose does, as the body works harder to keep glucose where it is. Our HOMA-IR calculator combines the two into one number from your own results.
- Triglycerides and HDL cholesterol tend to move with insulin resistance, triglycerides up and HDL down.
- ApoB counts the particles that carry cholesterol, and many doctors now follow it alongside LDL.
- ALT, a liver enzyme, often creeps up as fat builds in the liver and comes back down with weight loss.
- Vitamin B12 is worth keeping an eye on if you take metformin, which can lower it over the years.
Body weight is not a blood test, but it belongs on the same timeline. Many changes in these markers follow a change in weight.
How to make your results comparable
Blood sugar and lipid results are easy to disturb. These habits remove most of the noise.
Fast the same way every time
Glucose, insulin and triglycerides all rise after eating. Follow your lab's fasting instructions, usually nothing but water overnight, and do it the same way for every test. A fasted result and a non-fasted one can't be compared.
Test in the morning
Glucose and insulin follow a daily rhythm, and a morning appointment is the easiest one to repeat. It also makes the fast easy.
Skip alcohol and big late meals the day before
Both can push triglycerides up the next morning, sometimes a long way. One heavy evening can make a whole lipid panel look worse than your usual.
Note illness, poor sleep and new medication
Infection, a run of short nights and some medications, steroids in particular, raise blood sugar for a while. One line next to the result explains it later.
Know what can throw HbA1c off
HbA1c assumes your red blood cells live a normal lifespan. Iron deficiency can push it up. Recent blood loss, a transfusion or anything that shortens red cell life can pull it down, and some haemoglobin variants confuse certain methods. If HbA1c and your glucose readings tell different stories, mention it to your doctor.
Weigh yourself the same way, and use a weekly average
Same time of day, ideally in the morning before eating, on the same scale. Day-to-day weight swings with water and salt, so compare weekly averages, not single mornings.
Check the units
Glucose comes in mg/dL or mmol/L, HbA1c in % or mmol/mol, triglycerides in mg/dL or mmol/L. Mixed units in one list make any chart meaningless. Our free calculators convert the common ones.
Write down every change, with the date
A new medication, a change in strength, a new diet or training plan. HbA1c lags by weeks to months, so a result only makes sense if you know what happened in the three months before it.
How often should HbA1c be checked?
That depends on your situation and is for your doctor to decide. For people with diabetes, guidelines commonly suggest every three to six months. For people without it, it is usually much less often.
One fact helps whatever the schedule. Because HbA1c covers about three months, a retest sooner than that mostly measures the same period again. Fasting glucose, insulin and weight respond faster, so they are what show early whether a change is working.
What a slow climb looks like
This is a made-up person's HbA1c across two years of blood tests, with the stacks shaded.
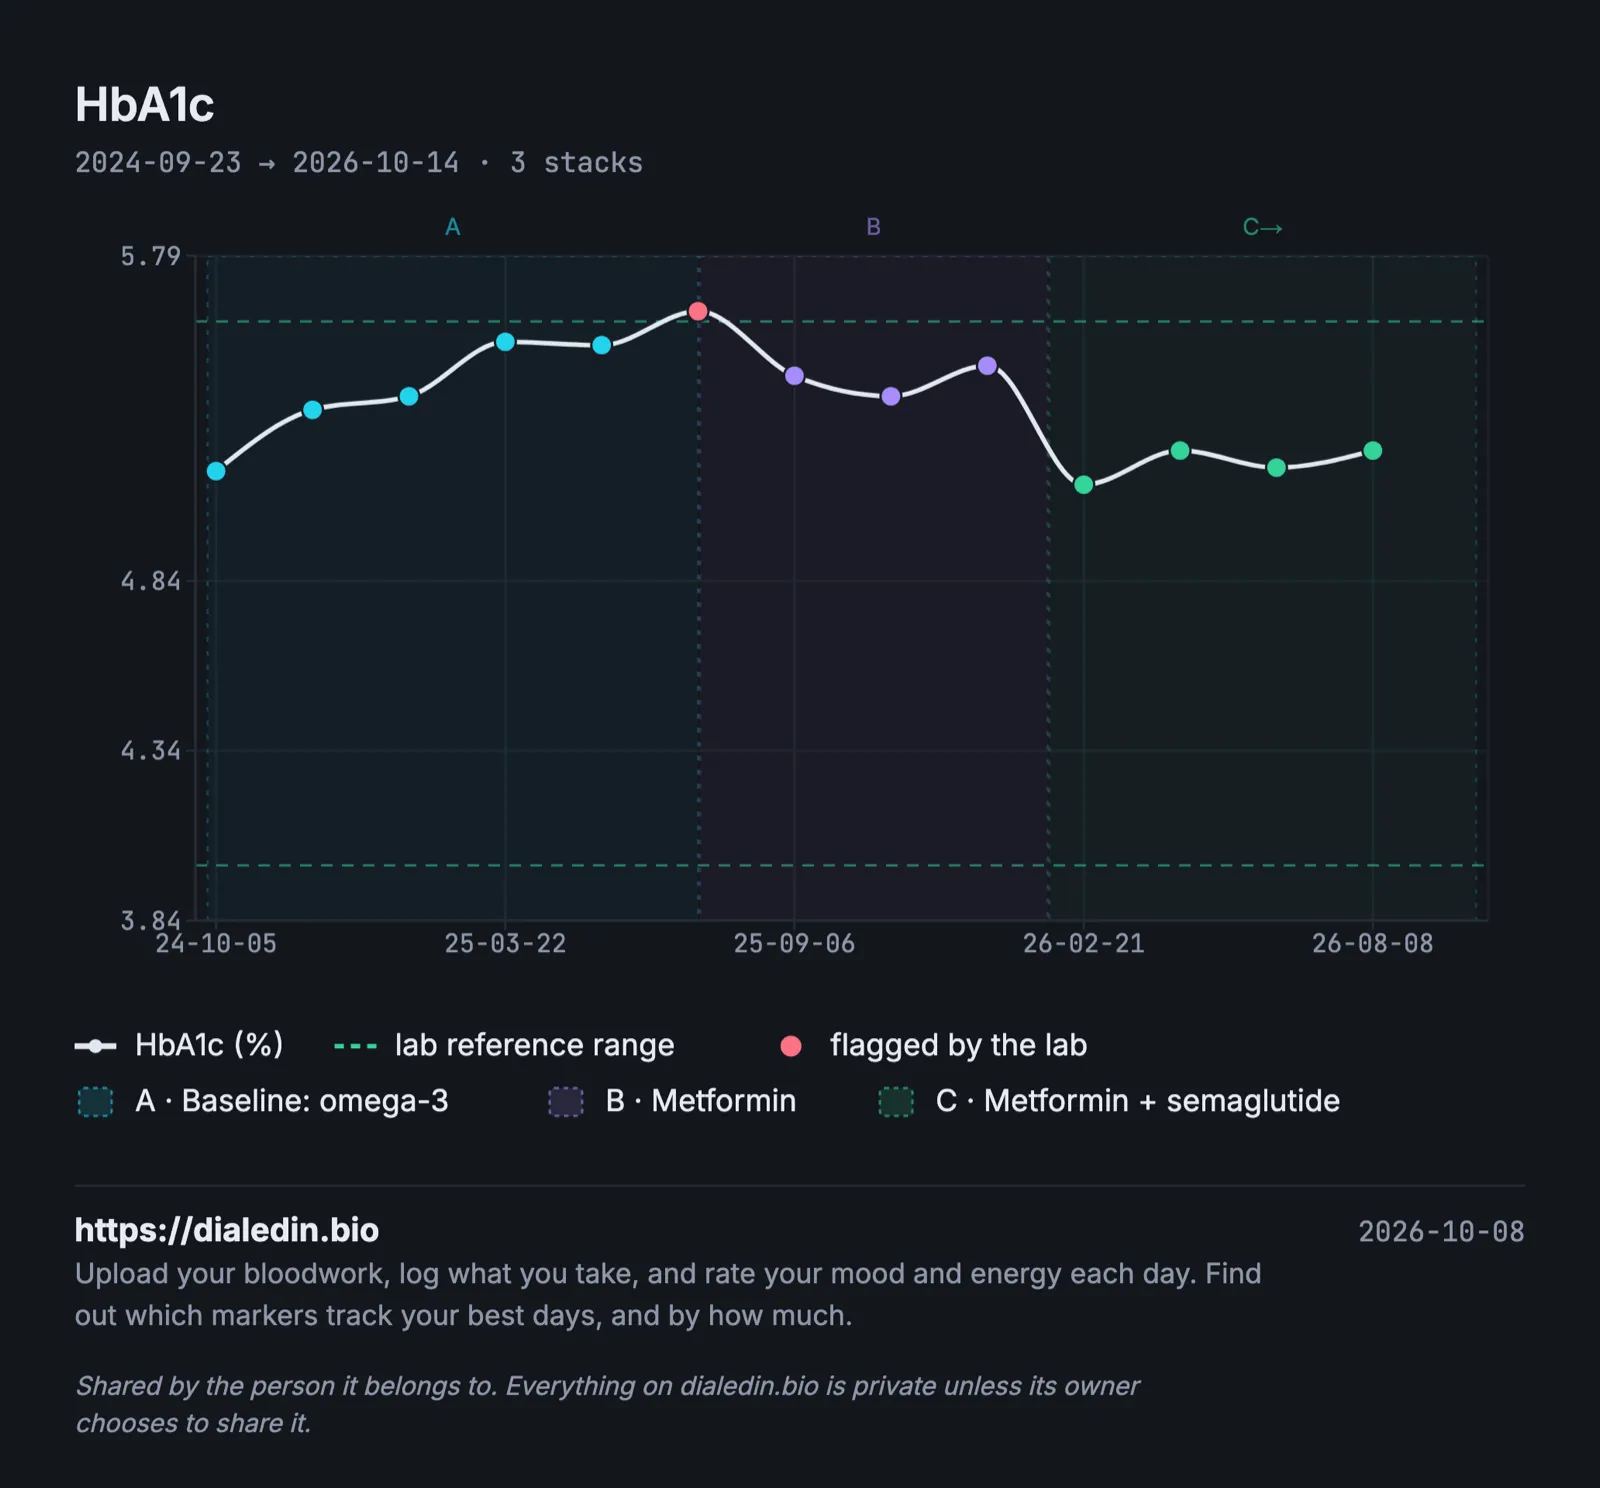
Sample data for a made-up person, not a real patient.
Every result before the flagged one is inside the range, so each report alone looked fine. Lined up, the climb was visible for months before the first flag. With the stacks on the same chart, it is also clear what each change was followed by.
Doing it with a spreadsheet
You can start today. One row per marker per test, with the columns that make results comparable:
| Date | Lab | Marker | Value | Unit | Lab's range | Fasted | Weight, weekly avg | Changes since last test | Notes |
|---|---|---|---|---|---|---|---|---|---|
| 2025-03-04 | City Lab | HbA1c | 5.4 | % | 4.0-5.6 | yes | 98.2 kg | none | |
| 2025-03-04 | City Lab | Glucose | 94 | mg/dL | 70-99 | yes | 98.2 kg | none | |
| 2025-09-02 | City Lab | HbA1c | 5.5 | % | 4.0-5.6 | yes | 97.1 kg | started metformin 2025-07-14 | |
| 2025-09-02 | City Lab | Glucose | 92 | mg/dL | 70-99 | yes | 97.1 kg | started metformin 2025-07-14 | had a cold the week before |
Keep weight on a second sheet and copy the weekly average in next to each test. Keep one unit per marker and chart the ones you care about. It takes some discipline by hand, but it works.
Where dialedin fits
We built dialedin because that spreadsheet is easy to start and hard to keep up.
You upload a lab PDF and it is read into individual markers, which you check before saving. Every report goes onto one timeline, and different lab names for the same marker are merged into one line. You record what you take and when, so each result sits next to what you were on, and you can log your weight in the app or sync it from your phone. A short daily check-in covers energy, appetite, digestion and recovery, and shows which of your levels line up with your better weeks. Before an appointment you can export your history as a PDF.
It is free while we are in beta. There is more on metabolic tracking in dialedin, or you can put your results on one timeline now.
This article is general information, not medical advice, and it can't take your own history into account. Talk to your doctor about which tests you need and what your results mean for you.