Fasting glucose vs HbA1c: why they can disagree
Fasting glucose and HbA1c usually arrive on the same report, and people expect them to agree. Then one is flagged and the other isn't, or one went up while the other went down, and it's not obvious which to believe.
They measure different things over very different time spans. Fasting glucose is the sugar in your blood on one morning, after one night's sleep and one evening's meal. HbA1c is the share of haemoglobin in your red blood cells that has sugar stuck to it, which builds up over the cells' lifetime of about three months. One is a snapshot and the other an average, so disagreement between them is normal. The cases where it isn't normal usually have a reason you can find.
What each test measures
| Fasting glucose | HbA1c | |
|---|---|---|
| What it is | Glucose in the blood at the moment of the draw | Haemoglobin with glucose attached, as a share of all haemoglobin |
| Time span | That morning | Roughly the last two to three months, weighted to the most recent |
| Fasting needed | Yes, usually 8 hours or more | No |
| Moved by a bad week | Yes | Barely |
| Moved by red blood cell changes | No | Yes |
HbA1c can also be turned into an estimated average glucose with a published formula (Nathan et al., 2008). Some labs print it as estimated average glucose. It's still HbA1c, written in glucose units.
Why fasting glucose can be off on the day
Fasting glucose moves with things that have nothing to do with the last three months:
- A short or broken night's sleep.
- Stress, including a stressful trip to the clinic.
- An infection or a cold.
- Steroid medicines such as prednisone.
- A late, large meal the evening before, or a fast much shorter than intended.
- The morning rise in hormones that lifts glucose before you wake, which varies from person to person.
So a single high fasting glucose is often repeated before anything else is decided.
Why HbA1c can be off
HbA1c depends on how long red blood cells live, so anything that changes that changes HbA1c without changing blood sugar:
- Iron deficiency tends to raise it, and treating the iron can lower it again. Our post on ferritin and iron covers that side.
- Recent blood loss, a transfusion or faster red cell turnover tends to lower it.
- Some inherited haemoglobin variants affect some lab methods.
- Advanced kidney disease and pregnancy change it too.
When doctors suspect HbA1c isn't telling the truth, they sometimes use fructosamine, which averages over about two to three weeks and doesn't depend on red cells.
What the two look like together
This is HbA1c and fasting glucose from the same person over two years:
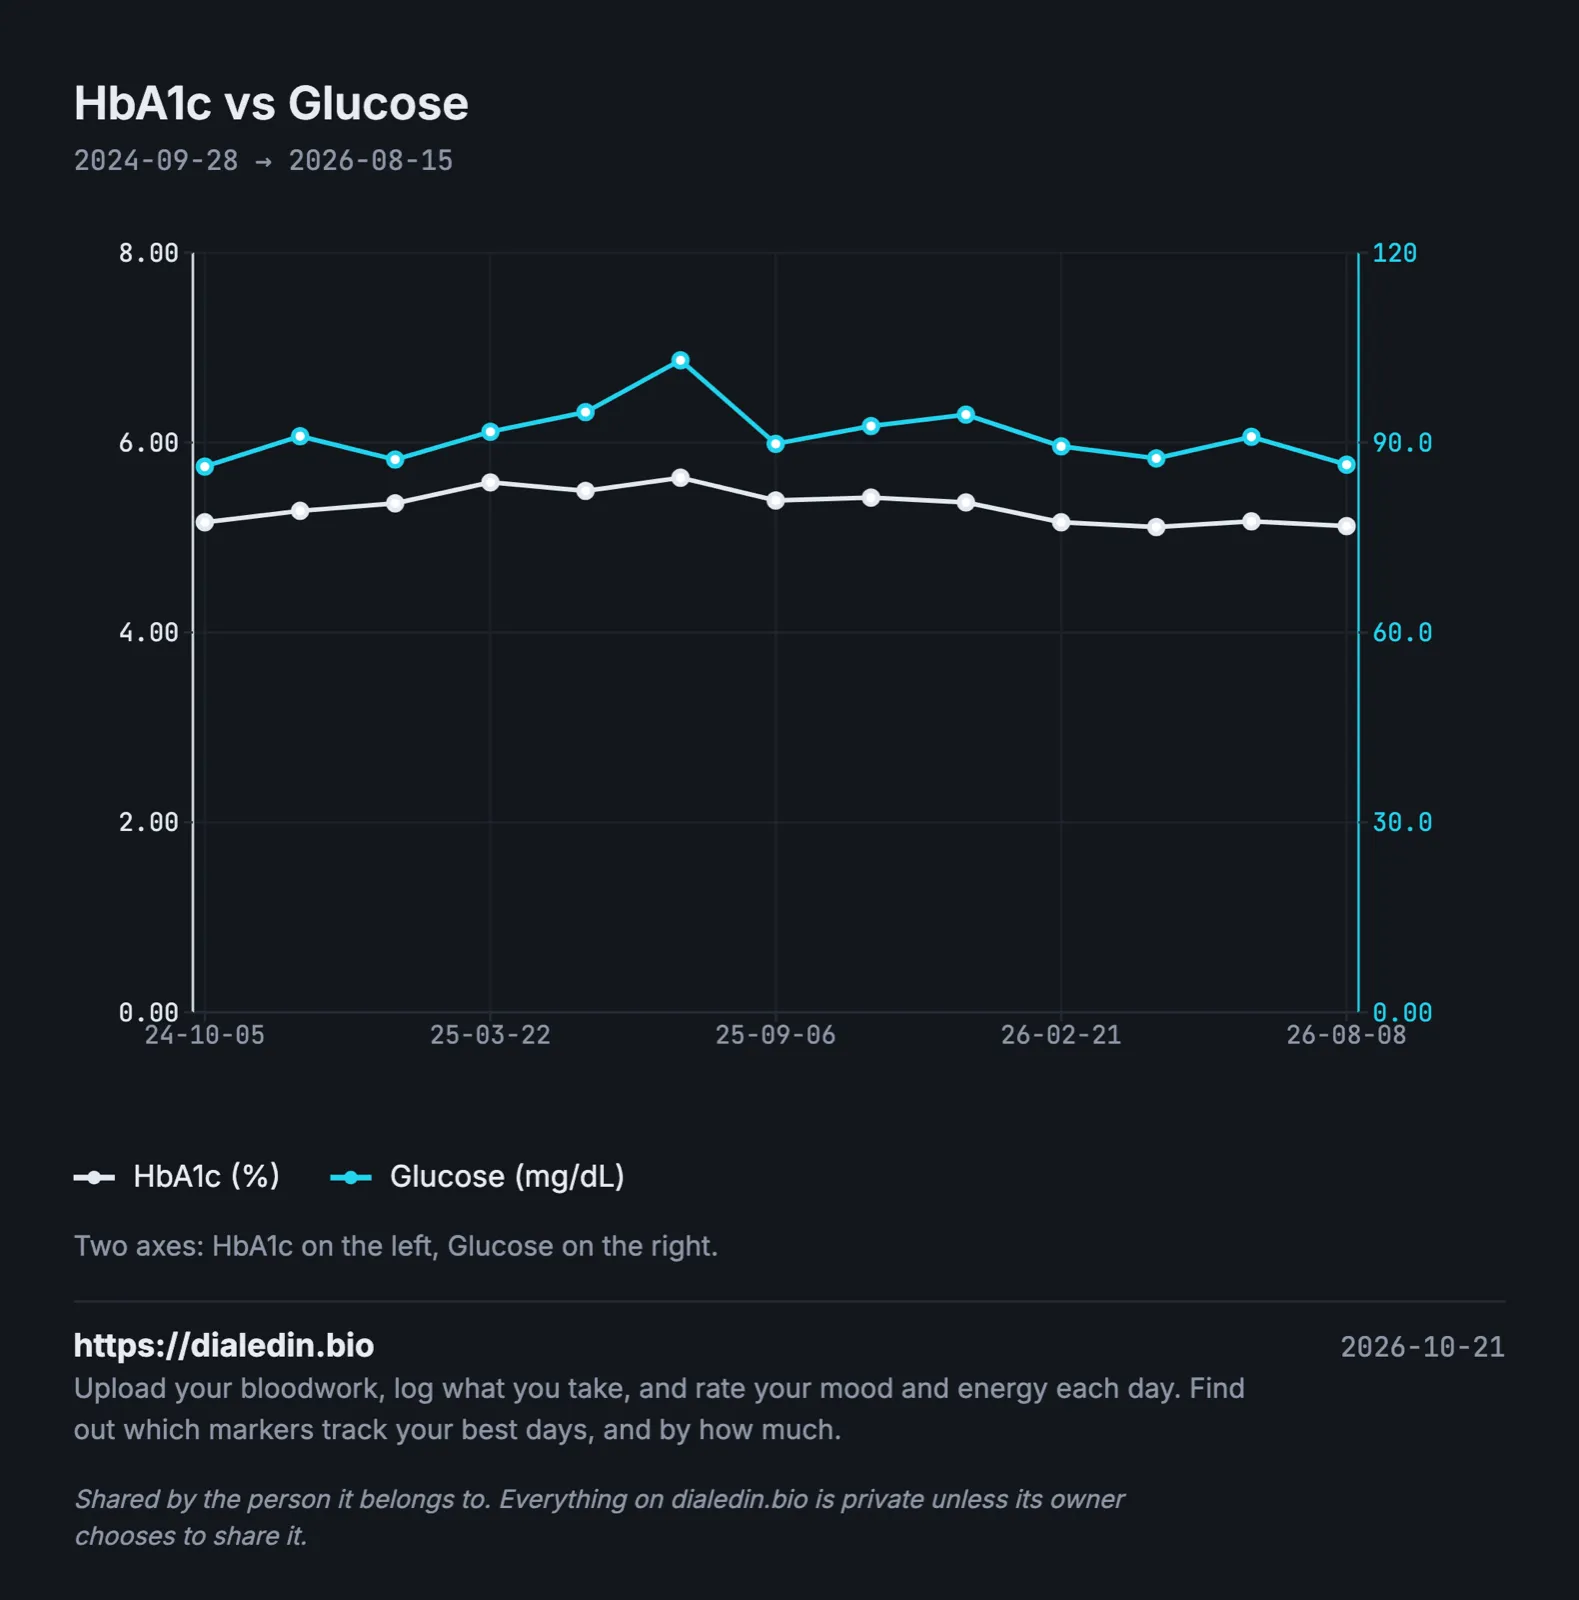
Sample data, not a real person.
HbA1c draws a smooth curve: up for most of a year, then down. Fasting glucose wanders around the same path with much more noise, and its one high result is a single morning. Read alone, that glucose result says more than it should. Next to HbA1c it looks like one day on the way up the curve.
How to make both results comparable
Fast the same length of time
Eight to twelve hours is the common instruction for fasting glucose. Twelve hours one time and six the next aren't the same test.
Test in the morning, at a similar time
Glucose rises through the early morning in many people. An 8am test and an 11am test differ.
Don't test when you're ill or after a bad night
If you are, note it. A glucose result from that morning describes that morning.
Note iron, blood loss and red cell changes
If you've started iron, donated blood or had heavy bleeding, write it next to the HbA1c result. It can move HbA1c by more than a change in diet would.
Watch the HbA1c units
Labs report HbA1c in % (NGSP) or mmol/mol (IFCC). They're the same test on different scales. Our post on HbA1c in % vs mmol/mol has the conversion.
Note medicines and their start dates
Metformin, GLP-1 medicines, steroid medicines and some others change one or both. The start date lets you see when the curve turned.
How often should these be checked?
Your doctor sets the schedule from your risk and any treatment. HbA1c moves slowly, so testing it more often than about every three months adds little. Fasting glucose often comes with every routine panel. Our post on tracking HbA1c over time has practical anchors, and the one on insulin resistance tests covers fasting insulin and HOMA-IR, which say more about how hard the body works to keep glucose in place.
A record you can keep by hand
| Date | Lab | Fasting glucose (mg/dL) | Hours fasted | HbA1c (%) | Slept well | Notes |
|---|---|---|---|---|---|---|
| 2025-05-18 | City Lab | 95 | 12 | 5.5 | yes | |
| 2025-07-13 | City Lab | 103 | 12 | 5.6 | no | four hours' sleep |
| 2025-09-07 | City Lab | 90 | 12 | 5.4 | yes | metformin since July |
The sleep column explains the glucose spike. The notes column explains the turn in HbA1c.
Where dialedin fits
We built dialedin so a snapshot and an average can be read on one chart.
You upload a lab PDF and it's read into individual markers, which you check before saving. Every report goes onto one timeline, and the same marker under different lab names stays one line. You can overlay HbA1c and glucose as above, and record what you take and when. Sleep and heart-rate data from your phone sit on the same timeline, and you can export your history as a PDF for your doctor.
It's free while we're in beta. If your glucose and HbA1c don't seem to agree, put them on one chart and see how they move together.
This article is general information, not medical advice, and it can't take your own history into account. Talk to your doctor about your blood sugar results and what they mean for you.