HbA1c in % vs mmol/mol: NGSP and IFCC explained
If you've had HbA1c tested in more than one country, or by more than one lab, you may have seen it as 5.6% on one report and 38 mmol/mol on another. Some reports print both, labelled NGSP and IFCC, and a few add an "estimated average glucose" on top.
They are the same test. HbA1c measures how much of your haemoglobin has glucose stuck to it, and the two numbers are that one measurement expressed on two different scales. 38 mmol/mol is 5.6%. A list that mixes them looks like a huge jump when nothing changed, so the first job with any HbA1c history is to pick one unit and convert the rest.
What NGSP and IFCC mean
The percentage is the older scale. It comes from the American NGSP programme, which ties every lab's method back to the DCCT, the large diabetes trial of the 1980s and 90s, so a percentage means the same thing everywhere it's used. The US and many other countries report it this way. On our glossary it's HbA1c (NGSP).
The mmol/mol scale comes from the International Federation of Clinical Chemistry, which built a more specific reference method in the early 2000s. It counts millimoles of glycated haemoglobin per mole of haemoglobin. The UK and much of Europe switched to it around 2009 to 2011, and many labs elsewhere print it alongside the percentage. That's HbA1c (IFCC).
Because IFCC's method is more specific, its numbers don't map onto percentages one to one. The two are linked by a fixed equation, called the master equation:
- IFCC (mmol/mol) = (NGSP % − 2.15) × 10.929
- NGSP (%) = IFCC (mmol/mol) × 0.0915 + 2.15
HbA1c conversion table: % to mmol/mol
Rounded to whole mmol/mol, the way labs print them:
| NGSP (%) | IFCC (mmol/mol) | Estimated average glucose (mg/dL) | Estimated average glucose (mmol/L) |
|---|---|---|---|
| 5.0 | 31 | 97 | 5.4 |
| 5.5 | 37 | 111 | 6.2 |
| 6.0 | 42 | 126 | 7.0 |
| 6.5 | 48 | 140 | 7.8 |
| 7.0 | 53 | 154 | 8.6 |
| 7.5 | 58 | 169 | 9.4 |
| 8.0 | 64 | 183 | 10.2 |
| 9.0 | 75 | 212 | 11.8 |
The table only converts units. It doesn't tell you what a result means for you, and the reference range printed on your own report is the one that applies to that lab.
What "estimated average glucose" is
Some reports add a third line, estimated average glucose or eAG. It isn't measured. It is calculated from HbA1c with an equation from a 2008 study that compared HbA1c with continuous glucose readings: eAG in mg/dL = 28.7 × HbA1c (%) − 46.7.
It's there to translate HbA1c into the units of a glucose meter. Because it's derived from HbA1c, tracking it as well adds nothing. Chart HbA1c and ignore the eAG line, or the other way round, but not both.
What changes HbA1c besides blood sugar
HbA1c depends on how long red blood cells live, since glucose builds up on them over their roughly three-month life. Anything that changes that lifespan changes HbA1c without any change in glucose. None of these is rare, and each is worth mentioning to whoever reads your results.
- Iron deficiency tends to push HbA1c up.
- Recent blood loss, a transfusion or anything that destroys red cells faster tends to pull it down, because the cells are younger.
- Some haemoglobin variants, such as sickle cell trait, interfere with some HbA1c methods. Labs can use a different method or a different test.
- Kidney disease and pregnancy can both shift it.
When HbA1c can't be trusted, doctors sometimes use fructosamine instead. It reflects the last two to three weeks.
How to track HbA1c across labs and countries
Pick one unit and convert everything into it
Use whichever your current doctor uses. Convert the old results with the equation above and keep the original next to it, so you can check a conversion later.
Note which unit the report used
Some reports print only a number with no unit next to it. A 42 is clearly mmol/mol and a 6.0 is clearly a percentage, but in the middle of a spreadsheet it's easy to paste the wrong one. A column for the unit costs nothing.
Don't fast specially for it
HbA1c doesn't change after a meal, so it doesn't need a fasting sample. If glucose is on the same panel, fast for that one, and do it the same way each time.
Leave about three months between tests
HbA1c moves slowly because red cells are replaced slowly. The last month counts most, but a full change takes about three months to show. Two tests six weeks apart mostly measure the same blood.
Write down iron, blood loss and anything that changed red cells
A course of iron, a blood donation or a heavy period can nudge HbA1c. One line in the notes saves you reading a trend into it.
Chart it with glucose and weight
HbA1c on its own shows the direction. Fasting glucose, fasting insulin and your weight show what came with it. Our post on tracking HbA1c over time covers that side, and the one on insulin resistance tests explains how HOMA-IR fits in.
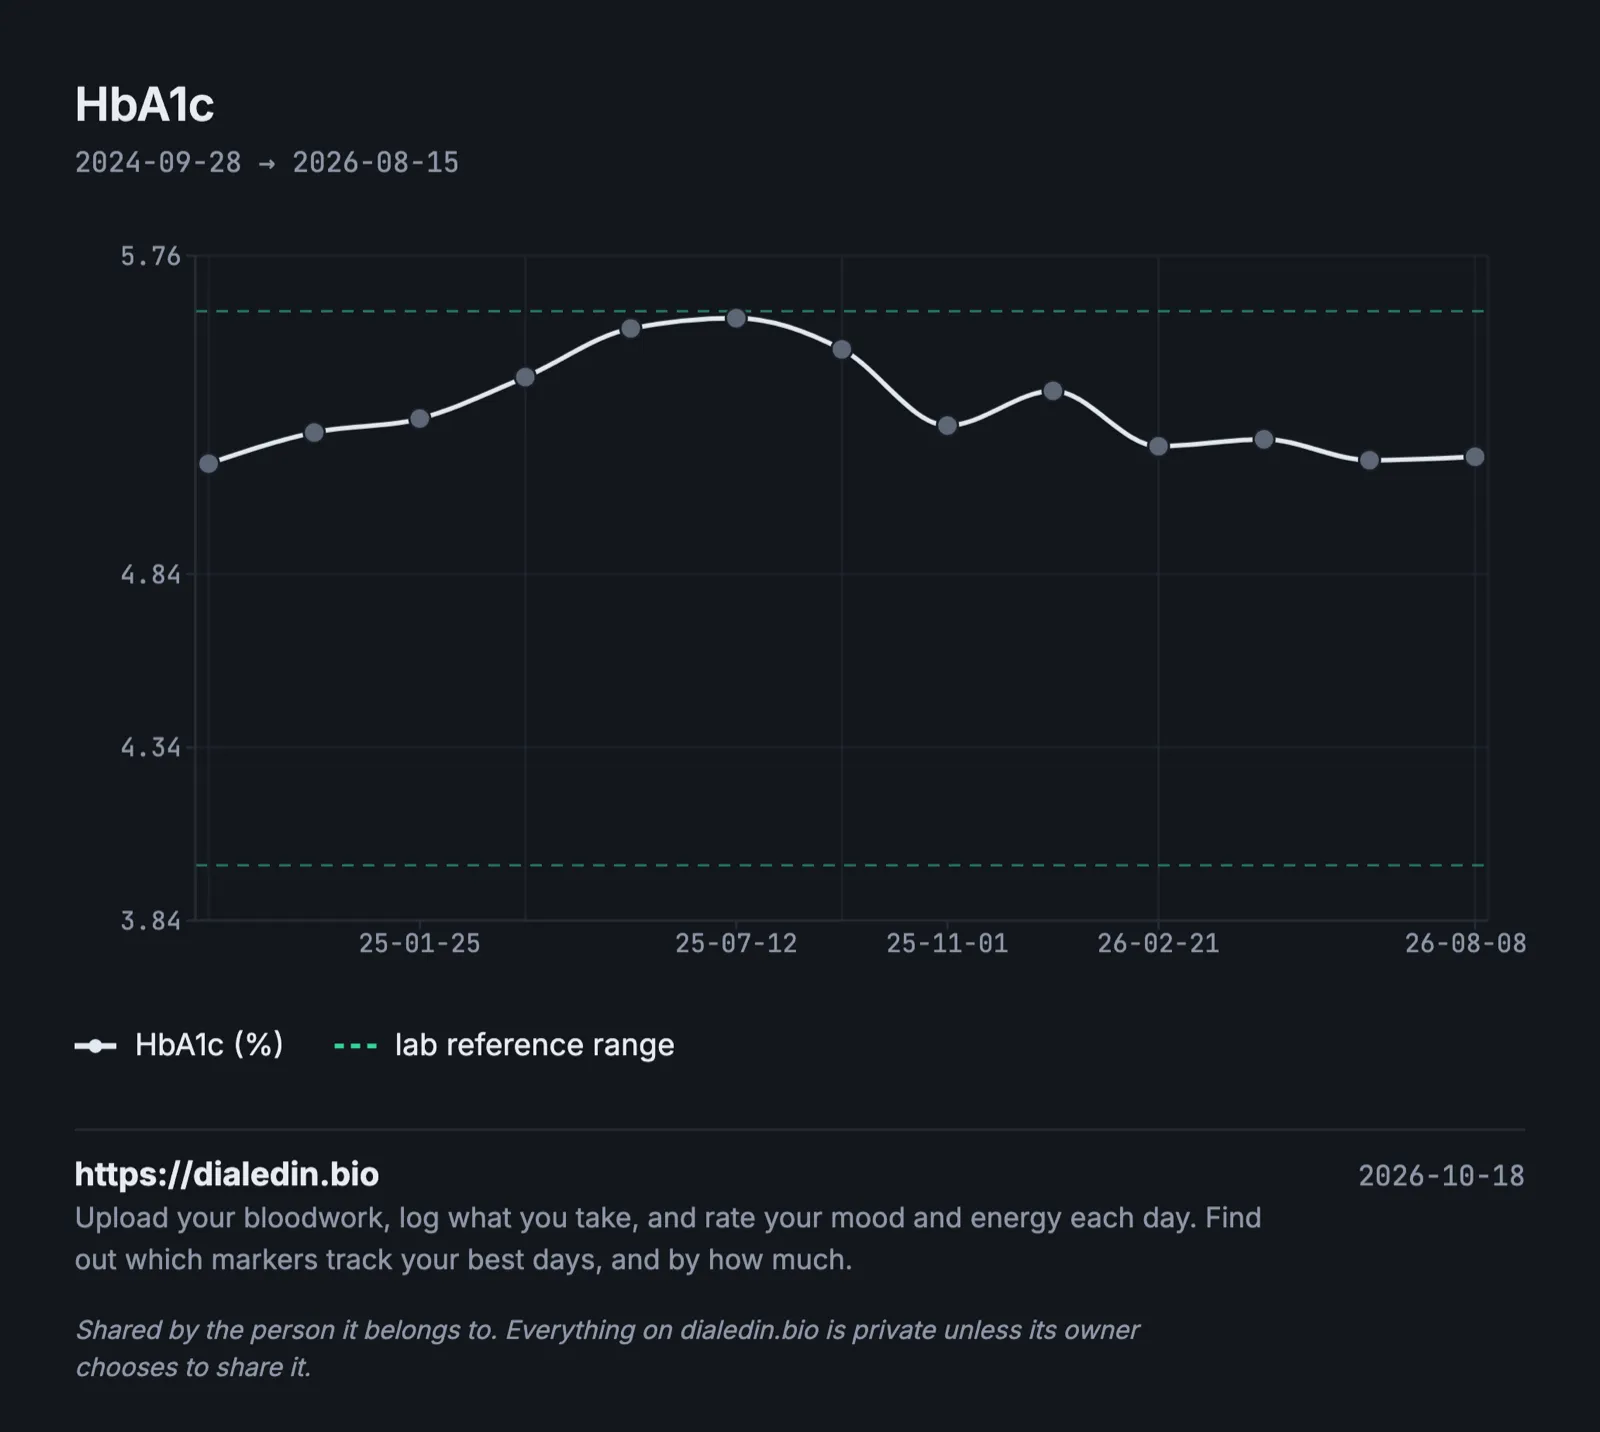
This is HbA1c across 13 tests over two years, in percent:
Sample data, not a real person.
In mmol/mol the same line would run from about 33 to 38 and back. The shape is the same in both units. What breaks a chart is mixing them.
How often should HbA1c be tested?
That's a decision for your doctor, and it depends a lot on any treatment you're on. Some general anchors: a baseline while you're well, a recheck about three months after a change in medication or diet, and regular spacing after that. Testing more often than every three months rarely shows anything new.
A spreadsheet that survives a change of lab
| Date | Lab | Value as printed | Unit | HbA1c (%) | Notes |
|---|---|---|---|---|---|
| 2024-11-02 | Lab in Madrid | 36 | mmol/mol | 5.4 | |
| 2025-05-20 | Lab in Madrid | 39 | mmol/mol | 5.7 | |
| 2025-11-18 | US clinic | 5.6 | % | 5.6 | new lab, new method |
Keep the value as printed, convert into one column and chart that column. The note on the last row is what stops a lab switch looking like a change in you.
Where dialedin fits
We built dialedin so a history like that doesn't have to live in a spreadsheet.
You upload a lab PDF and it is read into individual markers, which you check before saving. Every report goes on one timeline, and when two labs give the same marker different names, it stays one line. HbA1c in % and in mmol/mol are kept as two separate lines, because they are two different units, so you can see the history in each. You can mark what you were taking and when, such as a new medication or a diet, and each result sits next to it. If you want, a short daily check-in shows which levels line up with your better days, and you can export everything as a PDF for your doctor.
It's free while we're in beta. If your HbA1c results are spread across labs and units, put them on one timeline and see the trend.
This article is general information, not medical advice, and it can't take your own history into account. Talk to your doctor about how often you need HbA1c tested and what your results mean for you.