Triglyceride to HDL ratio: how to work it out
The triglyceride to HDL ratio is a number people meet on forums and in podcasts more often than on lab reports. Few labs print it, so most people work it out themselves, compare it with a number they read somewhere, and either relax or worry.
The catch is the units. Triglycerides and HDL cholesterol are different molecules, so the ratio in mg/dL and the ratio in mmol/L are different numbers for the same blood, by a factor of about 2.3. A ratio quoted without its units can't be compared with yours. Once you calculate it the same way every time, it's a simple and useful line to follow, because it moves when the two lines it's made of move in opposite directions.
How to calculate the ratio
Divide triglycerides by HDL cholesterol, both from the same report and in the same units.
| Your lab reports in | Ratio | To convert the ratio |
|---|---|---|
| mg/dL (US) | Triglycerides ÷ HDL | Divide by 2.29 to get the mmol/L ratio |
| mmol/L (UK, Europe, Australia) | Triglycerides ÷ HDL | Multiply by 2.29 to get the mg/dL ratio |
The 2.29 comes from the two conversion factors: about 88.57 for triglycerides and 38.67 for cholesterol. Some labs print the ratio as a line called triglycerides/HDL ratio; check which units it was worked out in.
Why people track it
High triglycerides and low HDL tend to come together in insulin resistance, the state where the body needs more insulin to keep blood sugar steady. Studies have linked a higher ratio with insulin resistance and with smaller, denser LDL particles. It's a rough signal, it varies with ethnicity and sex, and on its own it diagnoses nothing. Its main appeal is that it costs nothing: every lipid panel already has both numbers.
If insulin resistance is the question, more direct tests exist. Our post on insulin resistance tests covers fasting insulin, HbA1c and HOMA-IR, which you can calculate from a fasting glucose and insulin.
What moves the ratio
Anything that moves either line:
- A meal before the test raises triglycerides for hours. HDL barely changes.
- Alcohol the evening before raises triglycerides.
- Weight change, exercise and diet move both, often in opposite directions.
- Medicines such as testosterone, some progestins, steroid medicines and some blood pressure medicines can lower HDL. Our post on HDL on TRT covers that one.
- Fish oil in large amounts and some cholesterol medicines lower triglycerides.
Because a ratio divides one noisy number by another, it's noisier than either. A single result tells you less than a run of them.
This is both lines from the same person over two years:
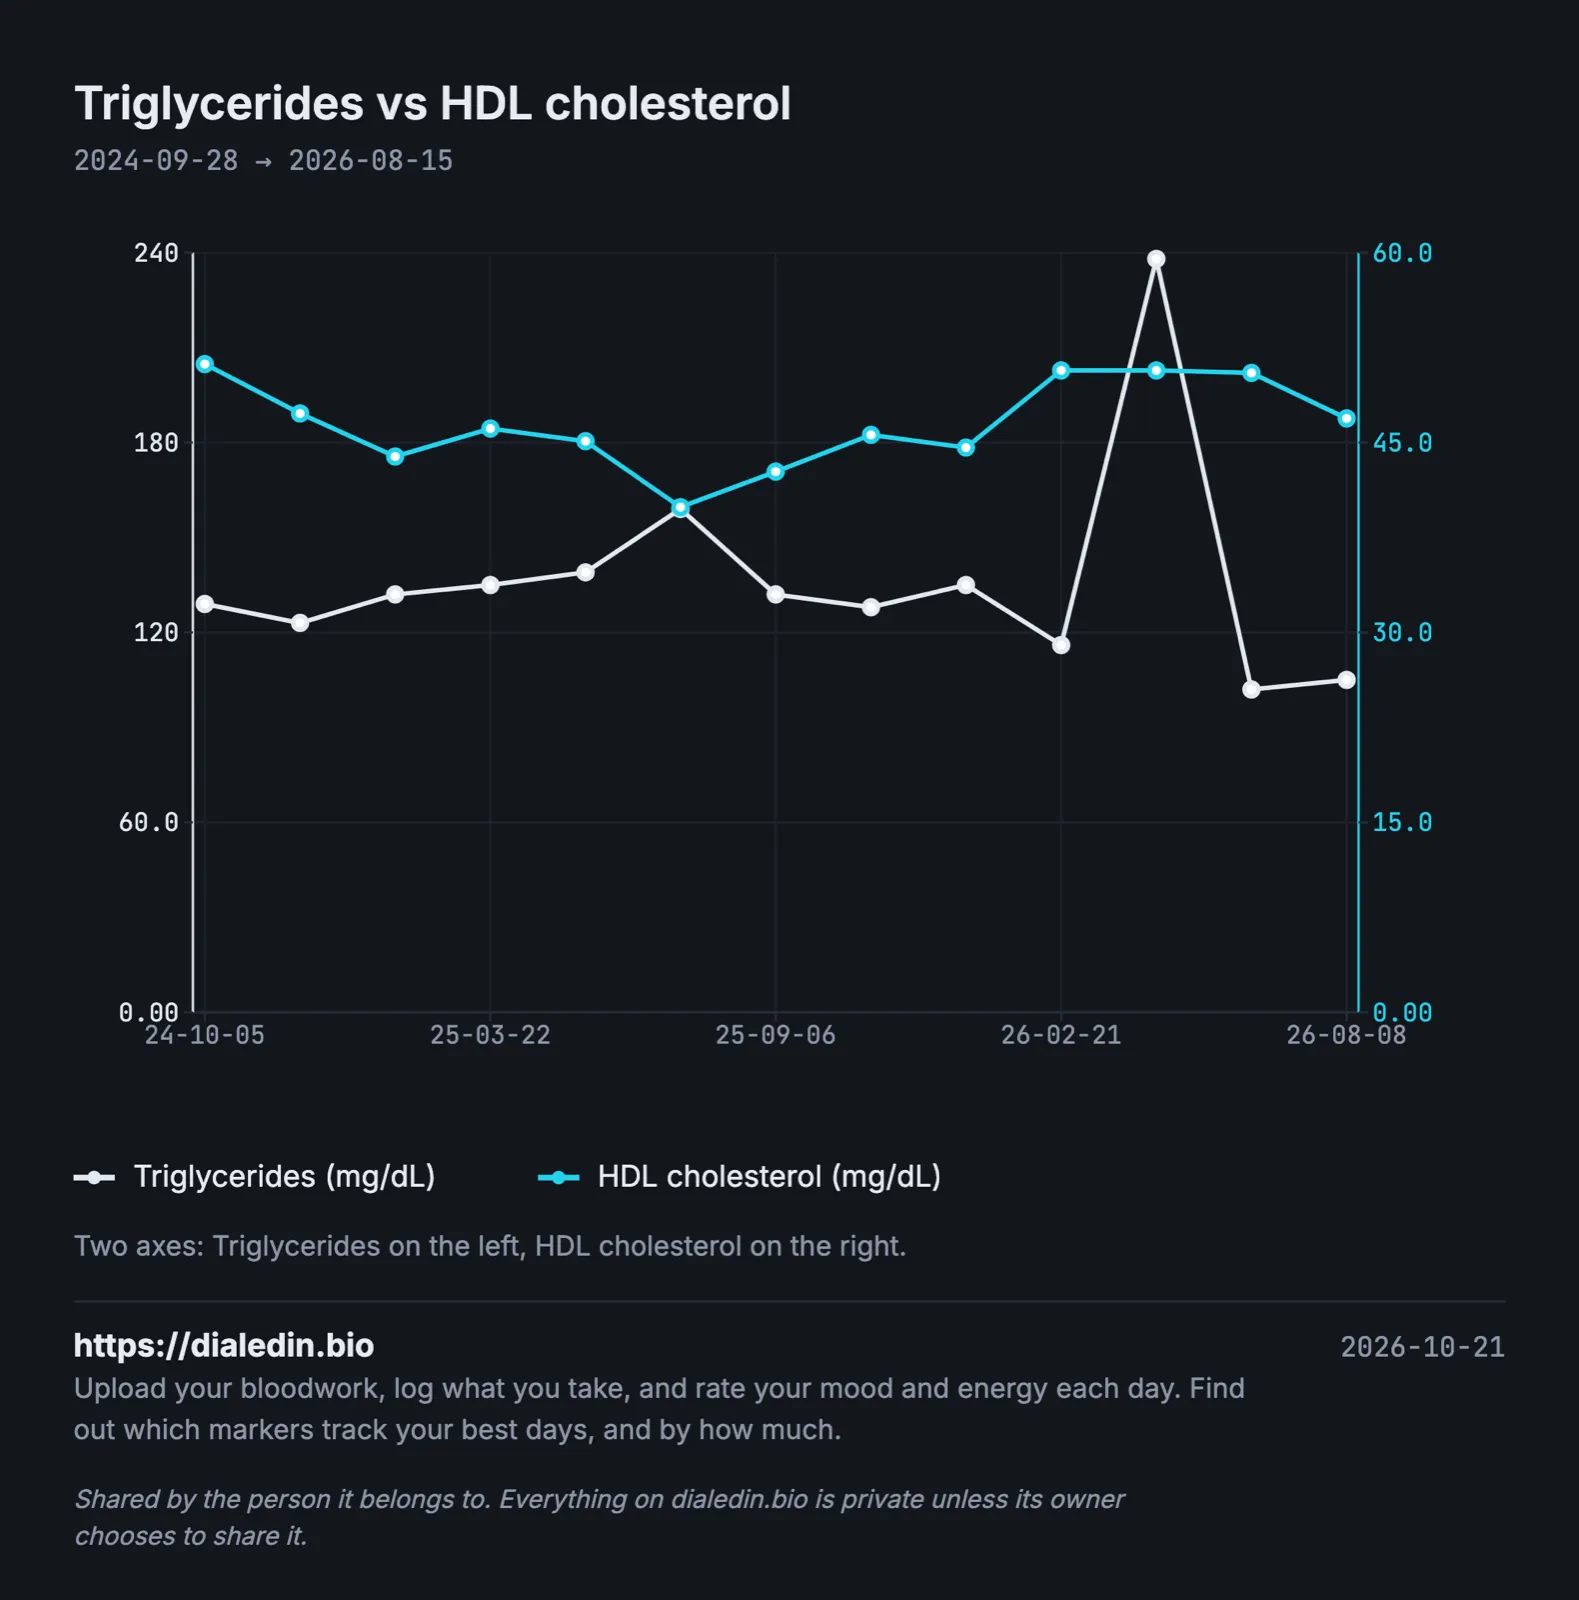
Sample data, not a real person.
Over the first year the lines move toward each other: the ratio goes from about 2.5 to 4.0 in mg/dL. Then they move apart again and the ratio settles near 2.2. The spring 2026 spike is one test taken after breakfast, and on that report alone the ratio jumps to 4.7.
How to keep the ratio comparable
Use the same units every time
Pick mg/dL or mmol/L for your own records and convert everything else into it. Write the units in the column header.
Calculate it only from one report
Triglycerides from one day and HDL from another give a ratio for no actual day.
Fast the same way each time
Triglycerides are the half that reacts to food. If one test was fasted and the next wasn't, the ratio comparison is broken. Your doctor decides whether you fast; you make it consistent.
Skip alcohol and hard exercise the day before
Both move triglycerides. A normal day before the test gives a normal result.
Note medicines and changes in weight or training
A new medicine, a diet or a few kilos either way shows up here. A note keeps a step explainable.
Watch for a missing value
Some labs don't calculate LDL when triglycerides are high, and some report HDL with a "<" sign at very low levels. Keep the original text.
How often is it worth calculating?
Every time you have a lipid panel. There's no separate schedule, and no reason to order an extra test just for the ratio. Our post on how to read a lipid panel covers how often panels are usually repeated.
A record you can keep by hand
| Date | Lab | Fasted | Triglycerides (mg/dL) | HDL (mg/dL) | TG/HDL (mg/dL) | Notes |
|---|---|---|---|---|---|---|
| 2024-10-06 | City Lab | yes | 129 | 51 | 2.5 | |
| 2025-07-13 | City Lab | yes | 159 | 40 | 4.0 | |
| 2026-04-19 | City Lab | no | 238 | 51 | 4.7 | breakfast before |
| 2026-06-14 | City Lab | yes | 102 | 51 | 2.0 |
Without the fasted column, the third row looks like the worst result in the table.
Where dialedin fits
We built dialedin so two lines like these can sit on one chart across years of reports.
You upload a lab PDF and it's read into individual markers, which you check before saving. Every report goes onto one timeline, and the same marker under different lab names stays one line. You can overlay triglycerides and HDL as above, record what you take and when, and use optional daily check-ins to see how you felt. You can export your history as a PDF for your doctor.
It's free while we're in beta. If you've been working this ratio out by hand, put your lipid panels on one chart and watch both lines at once.
This article is general information, not medical advice, and it can't take your own history into account. Talk to your doctor about your cholesterol and blood sugar results and what they mean for you.