LH and FSH blood tests: what the numbers show
LH and FSH usually get a glance and nothing more. They're two short lines on a hormone panel, often flagged in one direction or another, and next to testosterone or estradiol they look like supporting cast.
They're the signal, and testosterone and estradiol are the response. Both come from the pituitary gland, and both tell the testes or ovaries how hard to work. Reading them next to the hormone they control is how a doctor tells whether a low result comes from the gland making the hormone or from the signal reaching it. On their own, LH and FSH say much less, and they vary a lot from one draw to the next.
What LH and FSH do
LH (luteinising hormone) and FSH (follicle-stimulating hormone) are released by the pituitary in pulses, under the control of the hypothalamus. The pulses are why two results taken a few hours apart can differ quite a bit.
In men, LH tells the testes to make testosterone and FSH supports sperm production. In women, the two drive the monthly cycle: FSH grows the follicles that make estradiol, and a surge of LH in the middle of the cycle triggers ovulation.
The system runs on feedback. When testosterone or estradiol is high, the pituitary sends less LH and FSH. When they fall, it sends more.
LH and FSH in men
The useful reading in men is LH and FSH next to total testosterone.
| Testosterone | LH and FSH | What it usually points to |
|---|---|---|
| Low | High | The testes aren't responding to the signal, sometimes called primary hypogonadism |
| Low | Low or normal | The signal itself is low, from the pituitary or hypothalamus, sometimes called secondary |
| Normal | Normal | The system working as expected |
| High or normal, on therapy | Very low | The pituitary has turned its signal down in response to outside testosterone |
Several things blur these patterns. Being seriously ill, a very hard diet, high prolactin and some medications can all lower the signal for a while. Our post on prolactin blood tests covers that last one.
What happens to LH and FSH on TRT
Testosterone from outside the body is read by the pituitary like testosterone the body made, so LH and FSH fall, often to the bottom of the range or below it. Because FSH supports sperm production, this is why testosterone therapy lowers fertility, and why some men use something alongside it meant to keep the testes working.
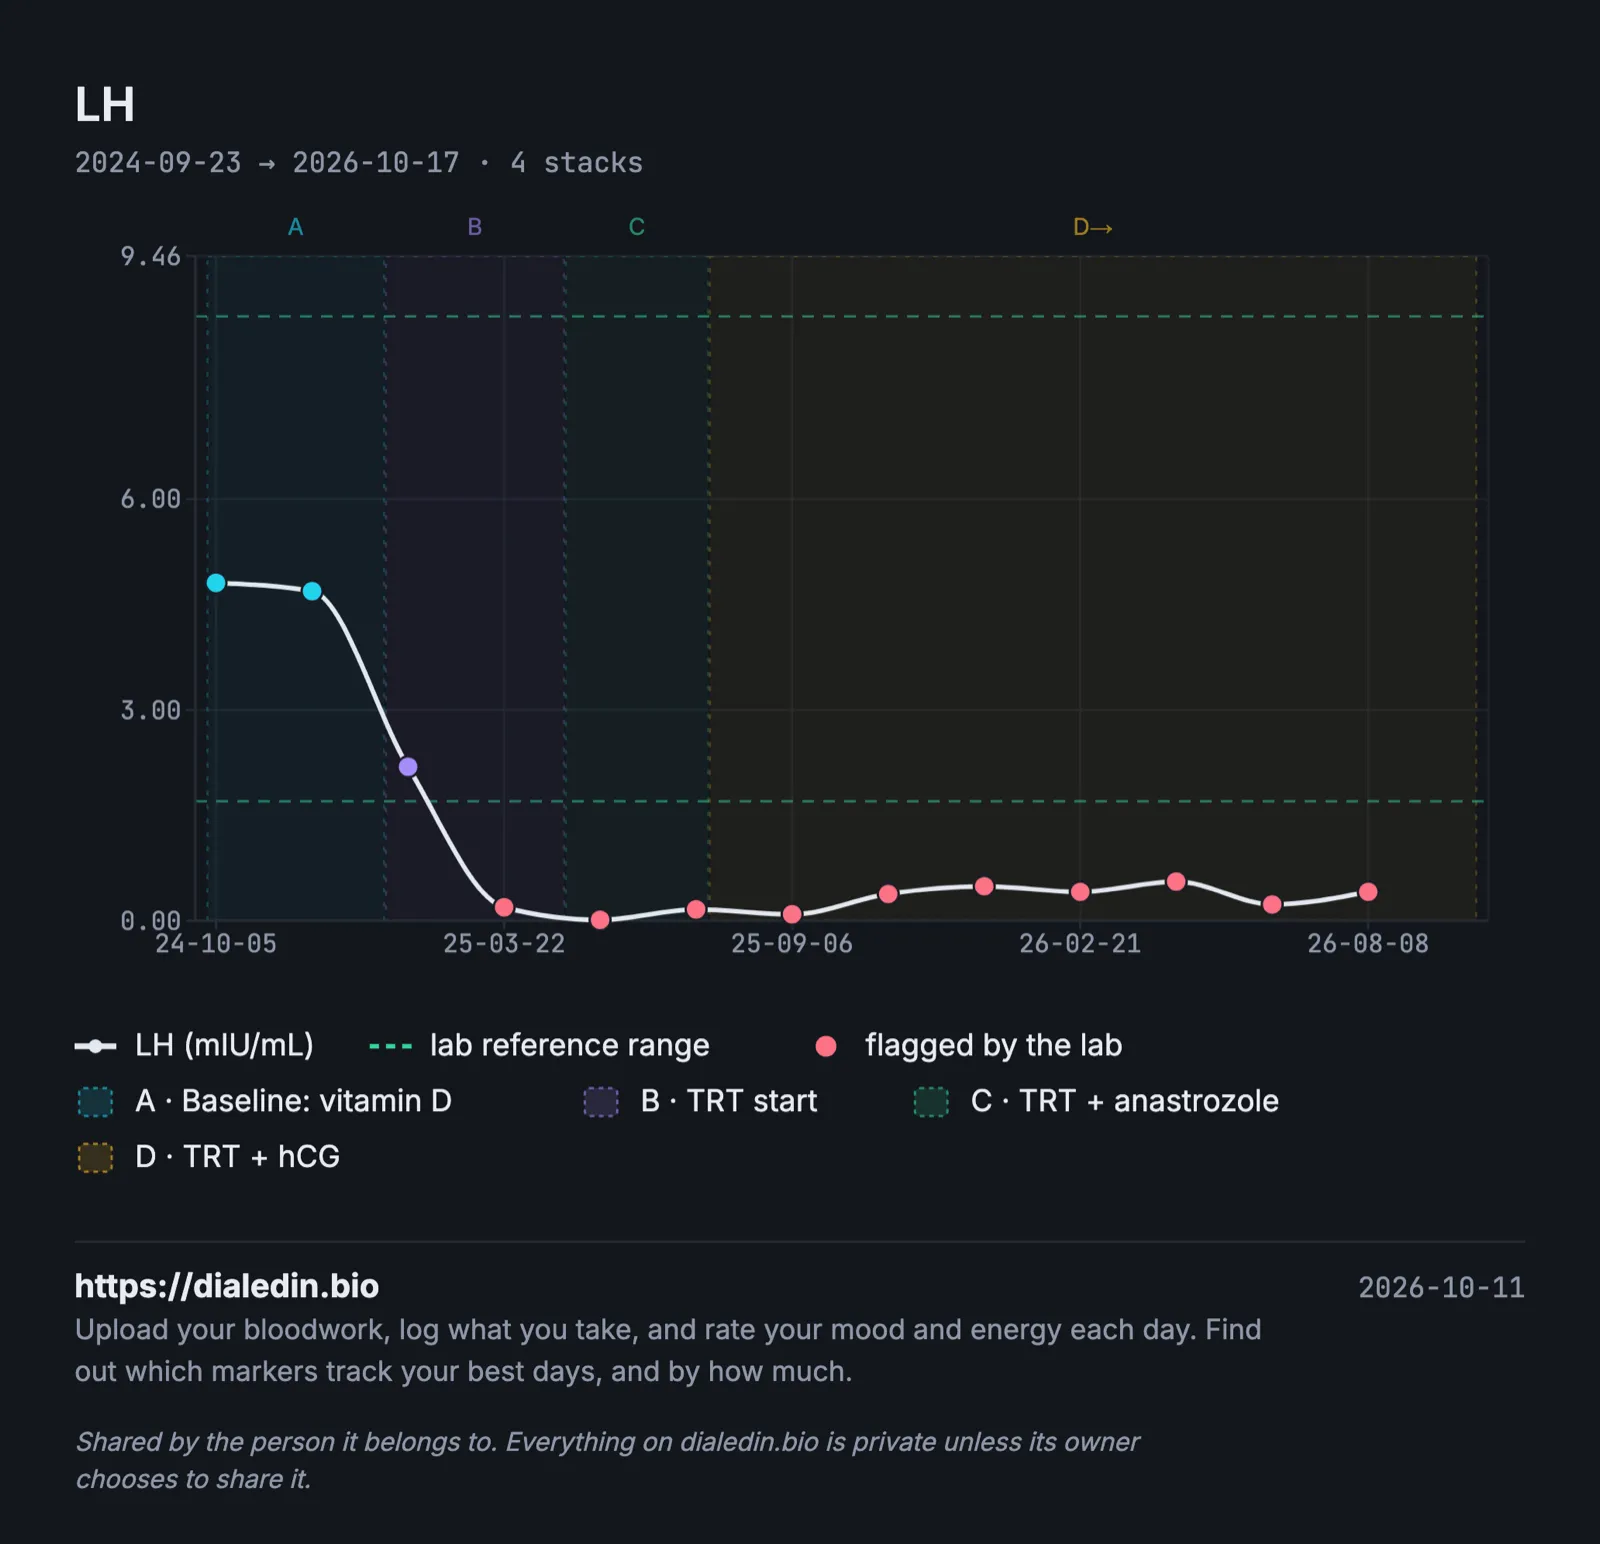
This is one person's LH before and after starting therapy, with what he was on shaded:
Sample data, not a real person.
LH fell below the range within a couple of months and never came back. It stayed low after hCG was added too, which surprises people. hCG acts on the same receptor in the testes that LH does, so it can stand in for the signal, but the pituitary still sees the outside testosterone and keeps its own LH turned down. A low LH on a report in that situation is expected.
LH and FSH in women
In women the same two numbers depend heavily on where in the cycle the blood was taken. FSH is usually tested on day 2 to 5 of the cycle, counting the first day of bleeding as day 1. LH can be several times higher mid-cycle, during the surge, than a few days earlier.
That's why a result without a cycle day is hard to read, and why labs print separate ranges for the follicular phase, the mid-cycle peak, the luteal phase and after menopause. Hormonal contraception suppresses both, so results on the pill don't describe your own cycle.
A high LH compared with FSH used to be part of how polycystic ovary syndrome was diagnosed. It isn't part of the criteria most doctors use now, though some reports still print an LH to FSH ratio.
FSH in perimenopause
As the ovaries wind down, the pituitary pushes harder, and FSH rises. In perimenopause it doesn't rise smoothly. It swings, sometimes from a near-normal result one month to a high one the next. The UK's NICE guideline on menopause advises diagnosing perimenopause and menopause in women over 45 with symptoms from the symptoms themselves, without blood tests (NICE NG23). The swings in FSH are one reason a single result says so little.
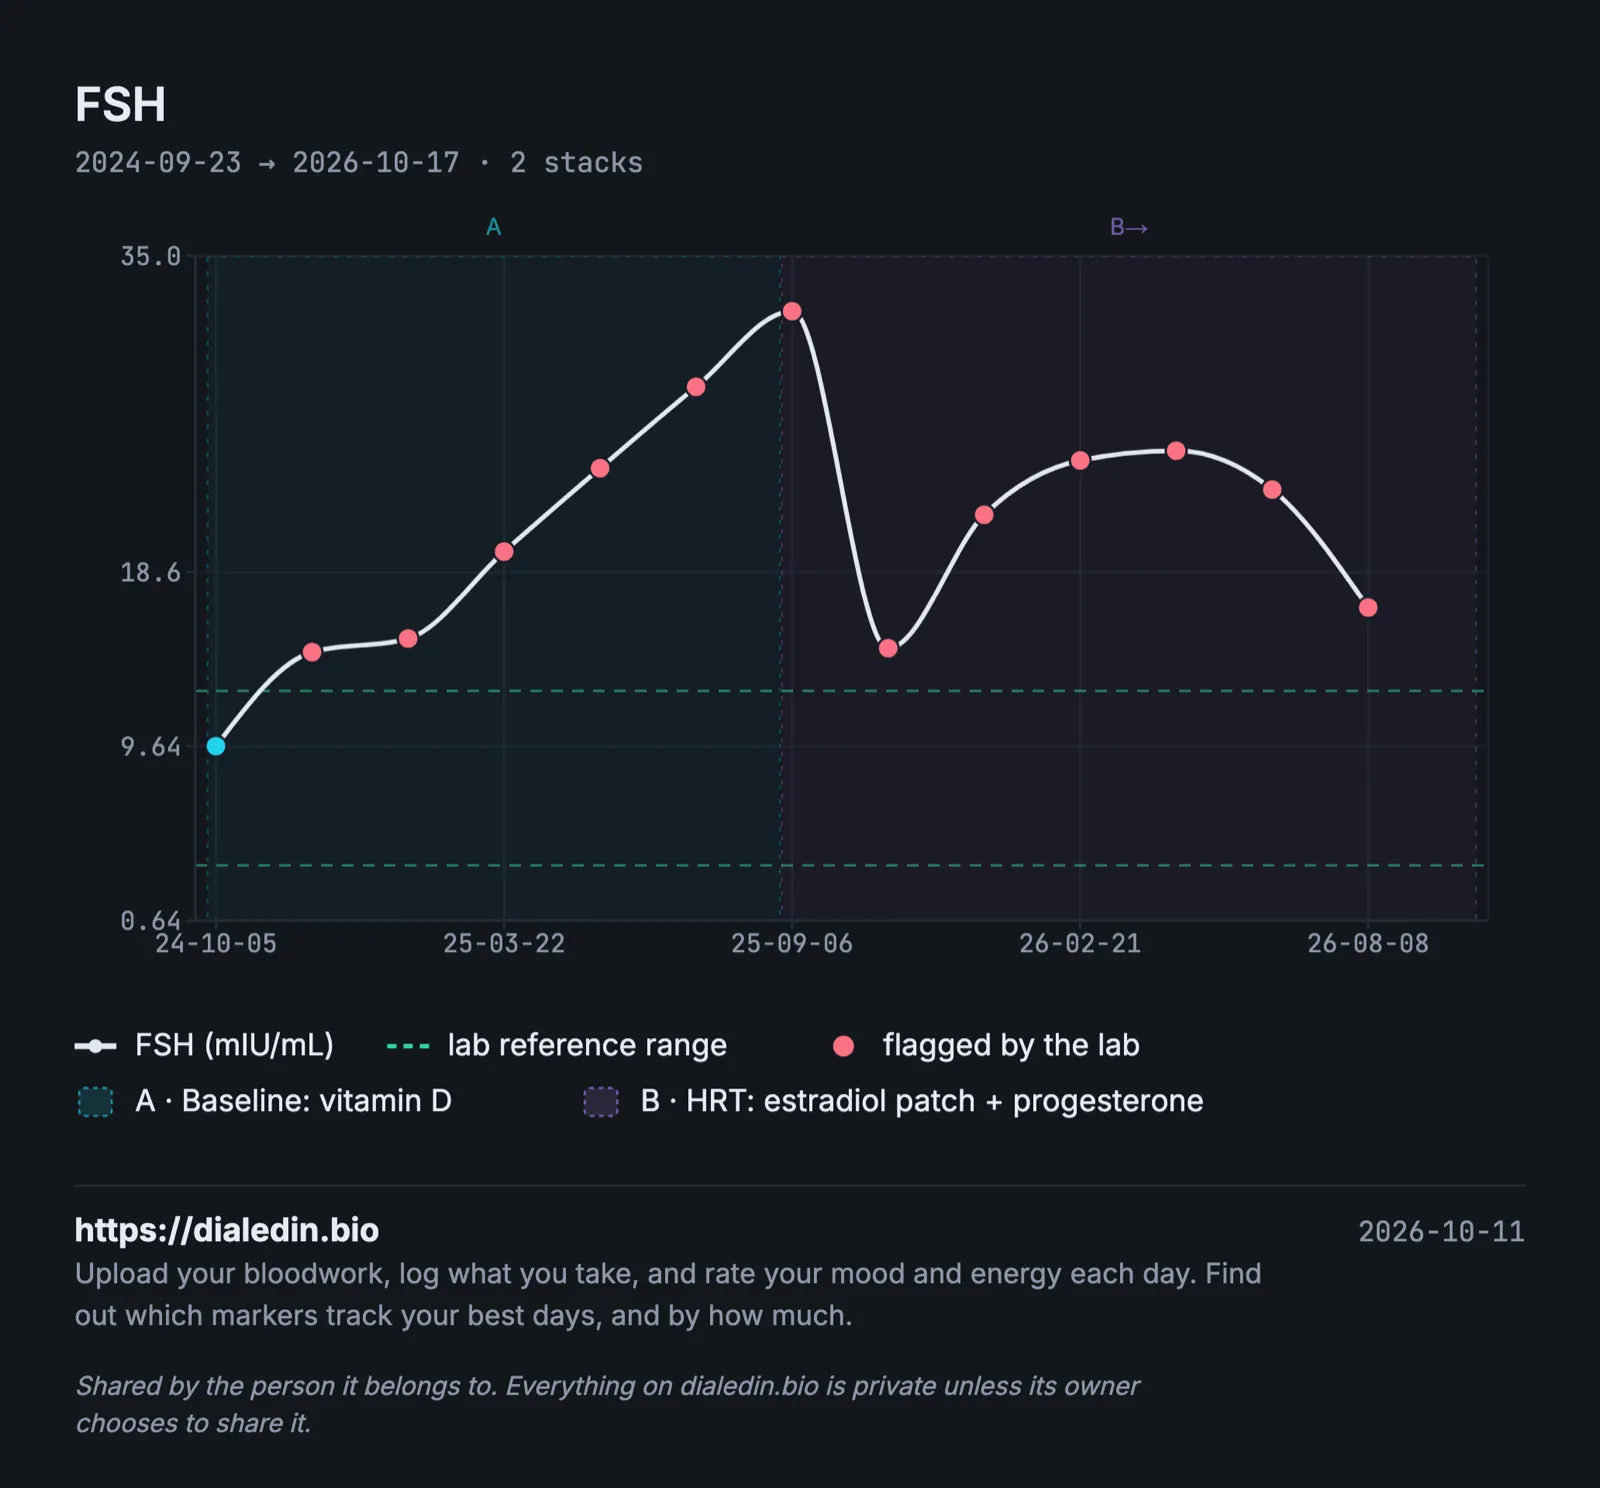
This is one woman's FSH across 13 tests over two years, with the start of HRT shaded:
Sample data, not a real person.
The first year is a steady climb. After HRT it drops, rises, and moves several points from one test to the next. Any one of those results, read alone, could tell a different story. Our post on tracking hormones through perimenopause goes into keeping a symptom diary next to these.
How to make LH and FSH results comparable
Write down the time of the draw
Because both are released in pulses, a single number has a wide margin. A consistent morning time removes one source of variation.
For women, write down the cycle day every time
Without it, a mid-cycle LH and an early-cycle one look like a huge change. If your cycle is irregular, note the date of your last period instead.
Note hormonal medication and contraception
The pill, HRT, testosterone and hCG all change LH and FSH. Write down what you were taking, and how long you'd been on it, next to each result.
Use the same lab
Ranges differ between labs and assays, and for women they differ by cycle phase as well. When you change labs, read the new result against its own range.
Repeat a surprising result before reading much into it
One high or low LH or FSH is often rechecked, because of the pulses and the cycle. Two results that agree carry far more weight.
How often to test them
There's no routine schedule. LH and FSH are usually ordered when there's a question to answer: low testosterone, fertility, an irregular cycle or symptoms around menopause. On testosterone therapy, they may be checked if fertility matters to you. Ask your doctor whether and when.
Tracking it in a spreadsheet
One row per test, with the context that makes the numbers readable:
| Date | Lab | LH (mIU/mL) | FSH (mIU/mL) | Testosterone or estradiol | Cycle day | Time | On | Notes |
|---|---|---|---|---|---|---|---|---|
| 2025-03-04 | City Lab | 6.1 | 9.8 | E2 88 pg/mL | 3 | 08:30 | nothing hormonal | |
| 2025-06-02 | City Lab | 9.0 | 24 | E2 41 pg/mL | 4 | 08:15 | nothing hormonal | cycle 45 days |
| 2025-09-08 | City Lab | 5.5 | 12 | E2 120 pg/mL | n/a | 08:20 | HRT since Aug |
Men can use the same layout with testosterone in place of estradiol and days since the last injection in place of cycle day.
Where dialedin fits
We built dialedin because LH and FSH only make sense next to everything else, and that's hard to keep together by hand.
You upload a lab PDF and it is read into individual markers, which you check before saving. LH, FSH, testosterone, estradiol and the rest go onto one timeline, and different lab names for the same marker are merged into one line. You record what you were taking and when, so each result sits next to the stack or HRT you were on, and a short daily check-in shows which levels line up with your better days. Before an appointment you can export your history as a PDF for your doctor.
It is free while we are in beta. There is more for women on HRT and for men on TRT, or you can put your results on one timeline now.
This article is general information, not medical advice, and it can't take your own history into account. Talk to your doctor about which tests you need and what your results mean for you.