Why regular bloodwork catches problems early
Most people read a blood test the same way. They open the PDF, look for anything marked H or L, and if nothing is marked they close it and forget about it until the next one.
That habit throws away most of the information. A single result tells you where a marker was on one morning. What usually matters more is which way it is moving, and you can only see that with several results side by side.
What the reference range on your report means
The range printed next to each result usually comes from a reference population. The lab measures a large group of people it considers healthy and reports the interval that holds the middle 95% of them.
Two things follow from that. About 1 in 20 healthy people will land outside the range on any single marker, so one flag on its own is often noise. And the range has to fit everybody, while your own results move around far less. For many markers the difference between two people is much bigger than the difference between your own results from one year to the next. Lab scientists call this the index of individuality.
So a marker can move a long way from your usual level and still sit inside the range. The useful question is whether a result is different from your previous ones, and whether it keeps moving in the same direction. You need your history to answer that.
Slow changes a single test can miss
Some changes build up over years. Each result looks fine on its own, and the trend only shows up when the results are lined up. None of these means anything is wrong, and most have harmless explanations, but they are worth spotting early and mentioning to your doctor.
- HbA1c and fasting glucose, the two common blood sugar markers, often creep up slowly. Every result can be in range while the line through them points upward.
- Creatinine and eGFR, which reflect kidney function, can shift gradually. One value says little. Five values over a few years show whether it is stable.
- ALT and AST are liver enzymes. A slow rise over several tests means something different from one high result after a hard gym session.
- Ferritin, your stored iron, usually falls well before haemoglobin does. If you only watch haemoglobin, you see an iron problem late.
- Haematocrit is routinely monitored on testosterone therapy. A gradual climb is easier to discuss with a doctor than a sudden surprise.
- TSH, the main thyroid marker, sometimes drifts in one direction for a couple of years before anyone acts on it.
- PSA is judged partly on how fast it changes between tests, which you can't see without the earlier results.
- Cholesterol and triglycerides are how you find out whether a change in diet, training or medication did anything. That only works if you kept the result from before.
In each case the early sign is a trend, and a trend needs at least three comparable results.
How to make your results comparable
A trend is only real if the tests were done the same way. A lot of apparent change between two reports comes from how and when the blood was taken. These habits remove most of that noise.
Use the same lab when you can
Labs use different machines and methods, and they print different reference ranges. Hormone results in particular can differ noticeably between methods. If you switch labs, expect a jump and don't read much into it.
Test at the same time of day
Several hormones follow a daily rhythm. Testosterone and cortisol are highest in the morning, which is why they are normally measured early. A morning result and an afternoon result are hard to compare.
Fast the same way every time
Triglycerides and glucose rise after a meal. If one test was fasted and the next one wasn't, comparing them tells you very little.
Skip hard training for a day or two before
Intense exercise raises CK, can push up AST and ALT, and can affect creatinine. A heavy leg day the evening before can make a healthy liver look stressed on paper.
Tell your doctor what supplements you take
Biotin in the large amounts found in many hair and nail products can interfere with some lab tests, including thyroid and hormone tests, and make results read too high or too low. Creatine raises creatinine, which can make kidney function look worse than it is.
Drink normally
Dehydration concentrates the blood and nudges up results like haematocrit and albumin.
Check the units
One lab reports testosterone in ng/dL and another in nmol/L. Glucose comes in mg/dL or mmol/L. Put mixed units in one list and any chart of it is meaningless. Our free calculators convert the common ones.
Write down anything unusual
If you were ill that week or had just started a new medication, add a one-line note next to the result. It will save you worrying about a number later.
How often should you get bloodwork?
There is no single answer. It depends on your health and on any treatment you are on, so the schedule is something to agree with your doctor.
A few things hold for most people. Get a baseline test while you feel well, because that is the result everything later gets compared with. Retest after a change, such as a new medication or a new diet: the follow-up is how you learn what the change did. If you are on something that gets monitored, stick to the schedule you were given.
Try to keep the gaps between tests roughly even, too. Evenly spaced results are much easier to read than three in one month followed by nothing for two years.
Keep every result in one place
For most people, lab history is scattered. A couple of PDFs sit in an email inbox, one is in a patient portal they no longer have the password for, and a printout from a private lab is in a drawer.
Even with every file in hand, a stack of PDFs doesn't show a trend. Comparing ferritin across five reports means opening five documents, finding the line, checking the unit and keeping the numbers in your head. Hardly anyone does it, so the trend goes unnoticed.
Putting every result on one timeline fixes that. Each marker becomes a line, and a slow climb that was invisible across separate PDFs is easy to see. The same marker often has different names at different labs, sometimes in another language, and in one place it can have one name. If you also note what you were taking and when, you can see whether a change in a marker lines up with a change in what you did.
It helps at the doctor's as well. A summary of every result from the last few years is far more use than "I think my iron was low once", and nothing gets lost when you change doctors or labs.
This is haematocrit across 15 blood tests over two years:
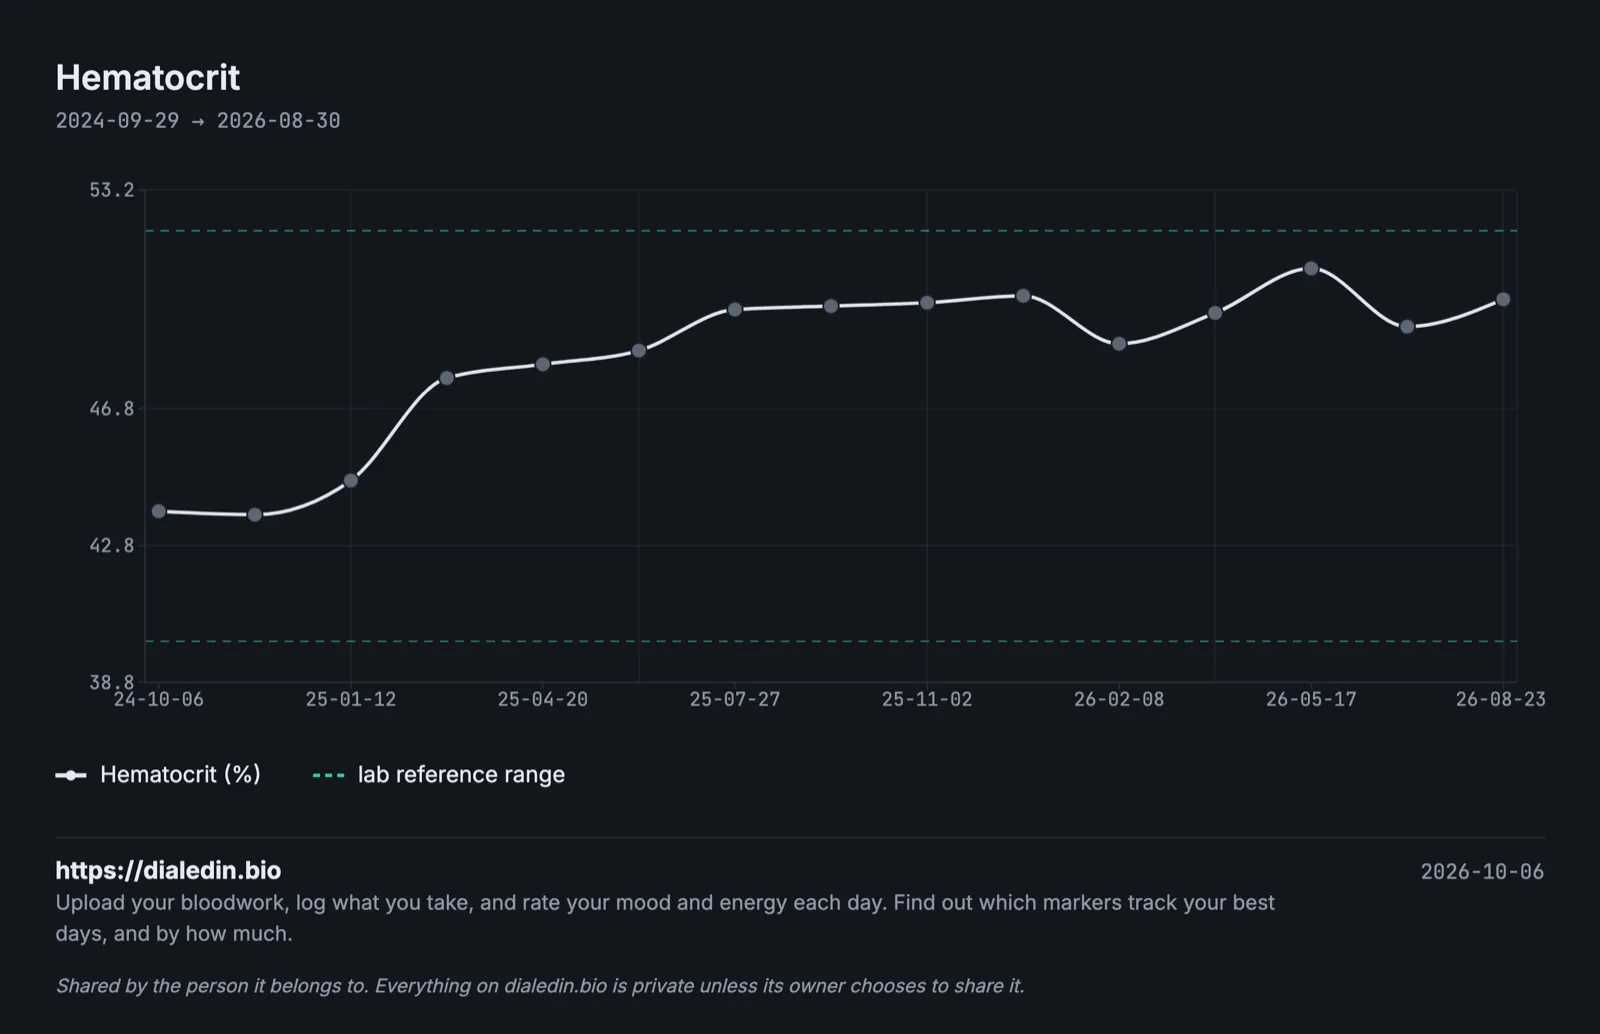
Sample data from our demo, not a real person.
Every result is inside the lab's range, the dashed lines, so no single report would have flagged anything. On one chart the climb is obvious.
Doing it with a spreadsheet
You don't need a special tool to start. A spreadsheet with one row per marker per test gets you most of the way. For example:
| Date | Lab | Marker | Value | Unit | Lab's range | Fasted | Time | Notes |
|---|---|---|---|---|---|---|---|---|
| 2025-03-04 | City Lab | Ferritin | 96 | ng/mL | 30-400 | yes | 08:10 | |
| 2025-03-04 | City Lab | Haematocrit | 46.2 | % | 40-52 | yes | 08:10 | |
| 2025-06-10 | City Lab | Ferritin | 81 | ng/mL | 30-400 | yes | 08:05 | had a cold that week |
| 2025-06-10 | City Lab | Haematocrit | 47.0 | % | 40-52 | yes | 08:05 |
Keep one unit per marker and make a chart for the markers you care about. Filling it in by hand is tedious, but it works, and it is a lot better than a folder of PDFs.
Where dialedin fits
We built dialedin because we were tired of keeping that spreadsheet by hand.
You upload a lab PDF and it is read into individual markers, which you check before saving. Every report goes onto the same timeline, and different lab names for the same marker are merged so each line stays continuous. You can record what you were taking and when, so each result sits next to what you were doing at the time.
If you want, you can also log a short daily check-in on how you feel and see which of your levels line up with your better days. Before a doctor's appointment you can export your history as a PDF.
It is free while we are in beta. If your results are spread across inboxes and patient portals, put them on one timeline and see how they have changed.
This article is general information, not medical advice, and it can't take your own history into account. Talk to your doctor about which tests you need and what your results mean for you.